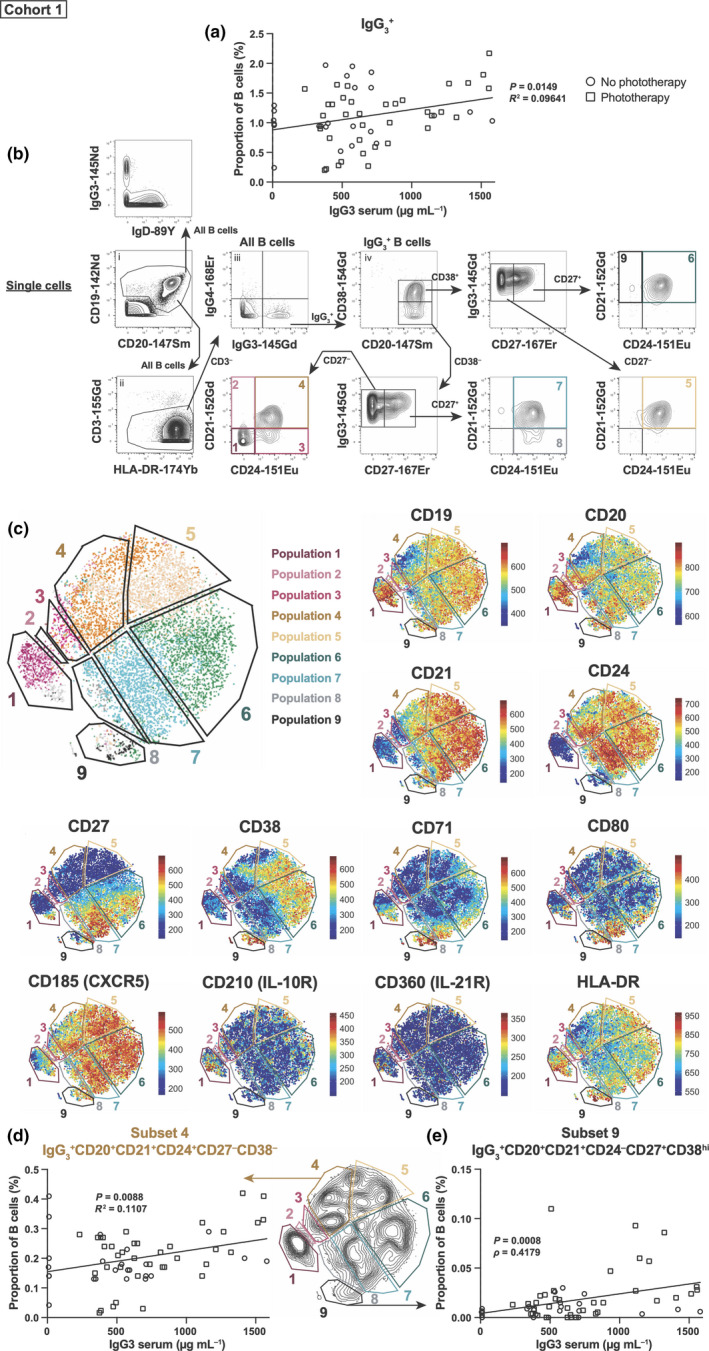
Figure 1.

Serum IgG3 levels correlate with IgG3 + B‐cell subsets. (a) IgG3 serum levels were compared with IgG3 + B‐cell levels (as a proportion of total B cells). (b) Manual gating strategy progressing from (i) to (iv) and beyond as indicated by the arrows to identify IgG3 +IgD−B cells and nine subsets using CD20, CD21, CD24, CD27 and CD38. (c) tSNE plots showing the position of the nine subsets and heatmap of markers used for gating and differentiating between these nine subsets. The proportions of subsets (d) 4 and (e) 9 had statistically significant correlations with IgG3 serum levels. Open black circles represent clinically isolated syndrome (CIS) patients who did not receive phototherapy (n = 8 patients, 25 time points), whilst open black squares represent patients who did receive phototherapy (n = 8 patients, 36 time points). A linear regression was done (with line shown), with reported P‐values and R 2‐values or ρ (rho)‐value. Mass cytometry data were generated from seven independent experiments.
