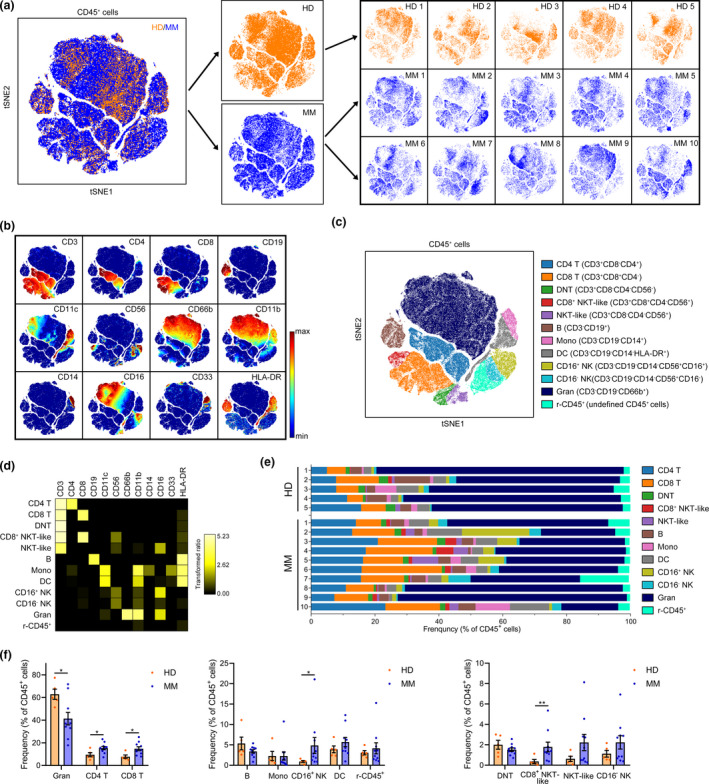
Figure 2.

Immune cell population changes in the BM of MM patients. (a) A viSNE map displaying gated CD45+ BM cells of five HD and 10 MM patients coloured by groups. (b) A viSNE map coloured by the normalised expression of indicated markers. (c) A viSNE map coloured by 12 main cell populations after clustering. (d) A heatmap showing the normalised median expression of 12 indicated markers in 12 cell populations. (e) Frequencies of 12 cell populations in CD45+ cells for each BM sample. Cell types are indicated by colour. (f) Bar plots showing the frequencies of indicated populations in BM CD45+ cells of HD and MM patients. HD, n = 5; MM, n = 10. DC, dendritic cells; DNT, double‐negative T; Gran, granulocytes; Mono, monocytes; NK, natural killer; r‐CD45+, the rest of CD45+. *P < 0.05 and **P < 0.01.
