Figure 3.

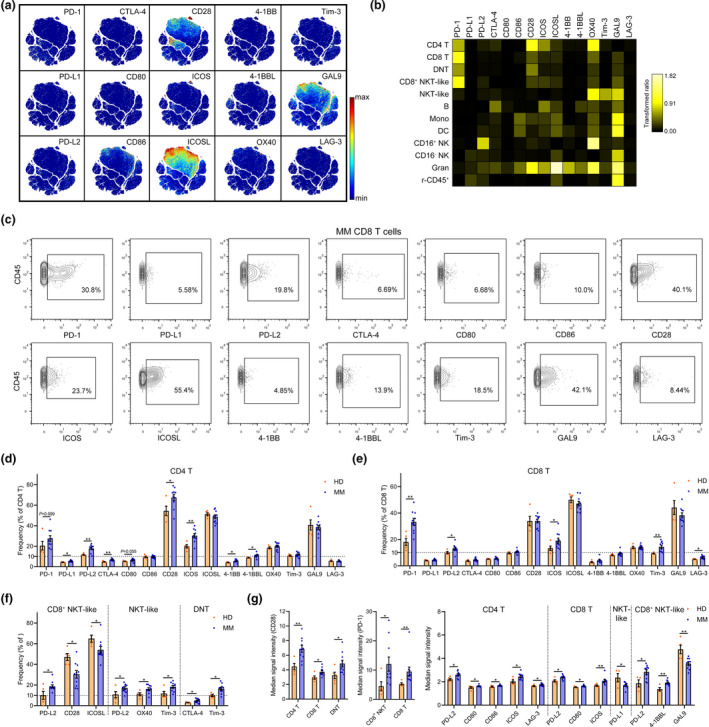
Immune checkpoint changes in MM BM T cells. (a) A viSNE map coloured by the normalised expression of 15 immune checkpoint markers. (b) Heatmaps showing the normalised mean expression of 15 immune checkpoint markers in all cell populations (normalised to the column's minimum). (c) Contour plots showing the gating strategy and the expression of indicated checkpoint molecules in CD8 T cells of one representative MM patient. (d, e) Bar plots showing the frequencies of indicated markers' positive cells in BM (d), CD4 and (e) CD8 T cells of HD and MM patients. (f) Bar plots showing the significantly changed frequencies of indicated markers' positive cells in CD8+ NKT‐like, NKT‐like and DNT cells of HD and MM patients. (g) Bar plots showing the significantly changed median signal intensity of indicated markers in corresponding positive T‐cell subsets of HD and MM patients. HD, n = 5; MM, n = 10. *P < 0.05 and **P < 0.01.
