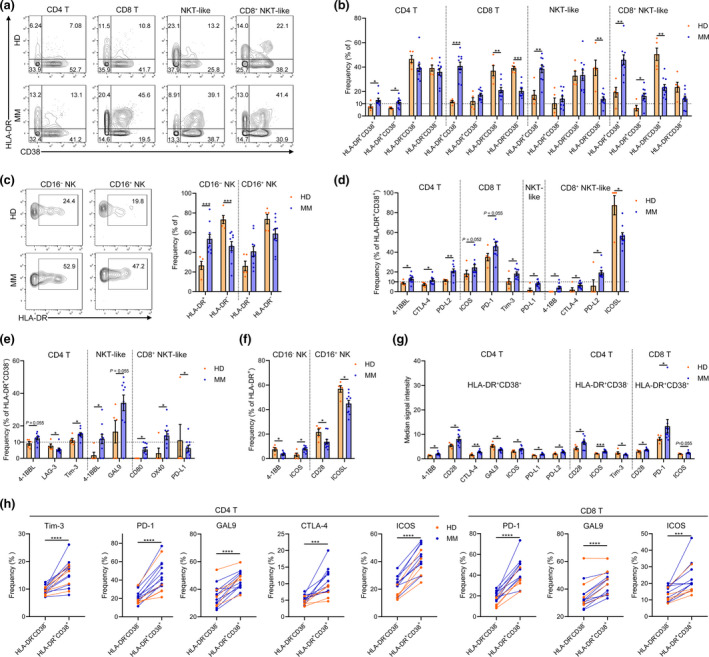
Figure 5.

Changes in T‐cell activation status in the BM of MM patients. (a) Contour plots showing the expression of CD38 and HLA‐DR in 4 T‐cell subsets of one representative HD or MM patient. (b) Bar plots showing the frequencies of indicated cell clusters in BM T‐cell subsets of HD and MM patients. (c) Contour plots showing the expression of HLA‐DR in NK cell subsets of one representative HD or MM patient (left panel). Bar plots showing the frequencies of indicated clusters in BM NK cell subsets of HD and MM patients (right panel). (d) Bar plots showing the significantly changed frequencies of indicated markers' positive cells in HLA‐DR+CD38+ T‐cell subsets of HD and MM patients. (e) Bar plots showing the significantly changed frequencies of indicated markers' positive cells in HLA‐DR+CD38− T‐cell subsets of HD and MM patients. (f) Bar plots showing the significantly changed frequencies of indicated markers' positive cells in HLA‐DR+ NK cell subsets of HD and MM patients. (g) Bar plots showing the significantly changed median signal intensity of indicated markers in corresponding positive HLA‐DR+CD38+ CD4 T, HLA‐DR+CD38− CD4 T and HLA‐DR+CD38+ CD8 T cells of HD and MM patients. (h) Dot plots showing the significantly changed frequencies of the indicated markers' positive cells in HLA‐DR−CD38− and HLA‐DR+CD38+ T‐cell subsets of the individual. HD, n = 5; MM, n = 10. *P < 0.05, **P < 0.01, ***P < 0.001 and ****P < 0.0001.
