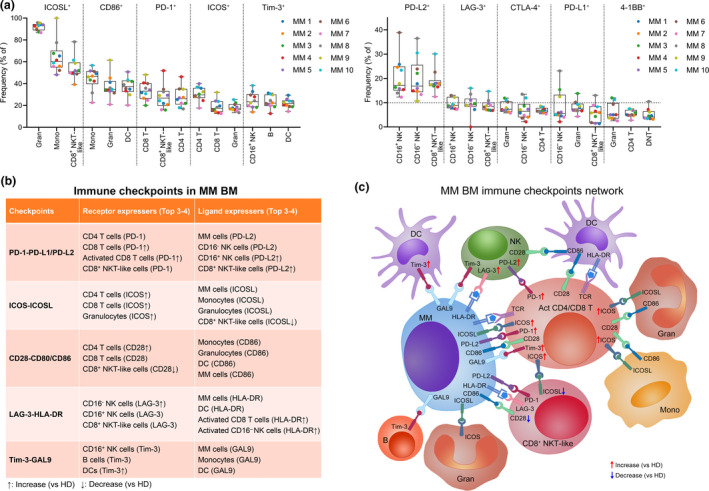
Figure 7.

The immune checkpoint network in the MM BM microenvironment. (a) Dot plots showing the top 3 frequencies of indicated markers' positive cells in immune cell types. Dots are coloured by individual. (b) A table listing all the important checkpoints and their top 3 or 4 providers. (c) A schematic diagram showing the main provider cells of immune checkpoint ligands and receptors, and the network among them in the MM BM microenvironment. Act, activated. MM, n = 10.
