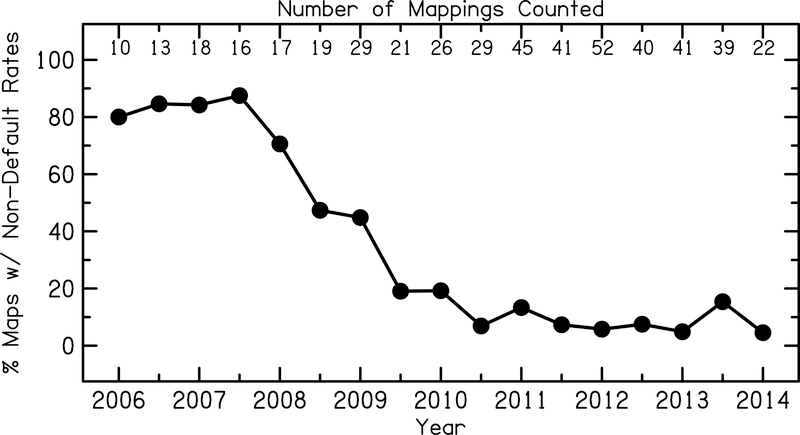
Figure 1:
Proportion of adult CI patients implanted with Cochlear Ltd. devices mapped at non-default stimulation rates at a CI mapping and surgical center in the Baltimore, MD – Washington, DC metropolitan area. Retrospective data was analyzed in six-month intervals from years 2006 to 2014. Analysis only includes actual mapping instances that occurred in each six-month interval, therefore, for example, patients that were mapped in 2012, but were not seen again until 2014 were only included in the 2012 and 2014 analysis and were not carried through into the 2013 analysis. The number of mappings in each six-month interval ranged from 10 to 52, and are listed at the top of the figure.

