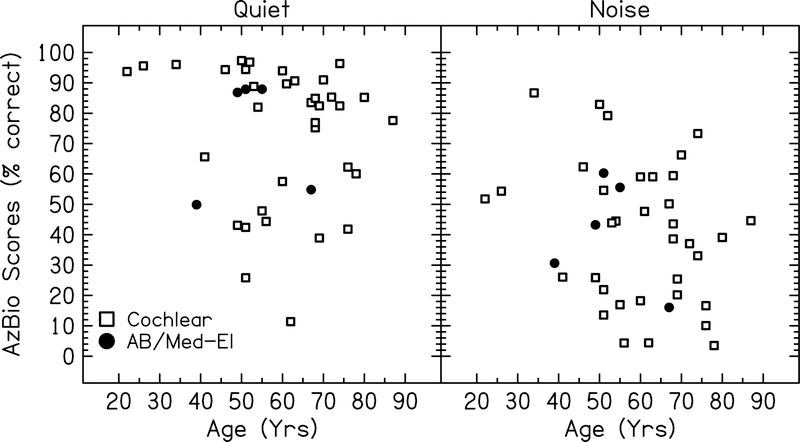
Figure 2:
Speech understanding scores for each subject for AzBio sentences in quiet and noise plotted as a function of chronological age. Each point represents the average speech understanding score across all stimulation rates tested for each subject. Open symbols represent the 35 ears with Cochlear devices included in the first model. Filled symbols represent the five ears with either Advanced Bionics (AB) or Med-El devices included in the second model.

