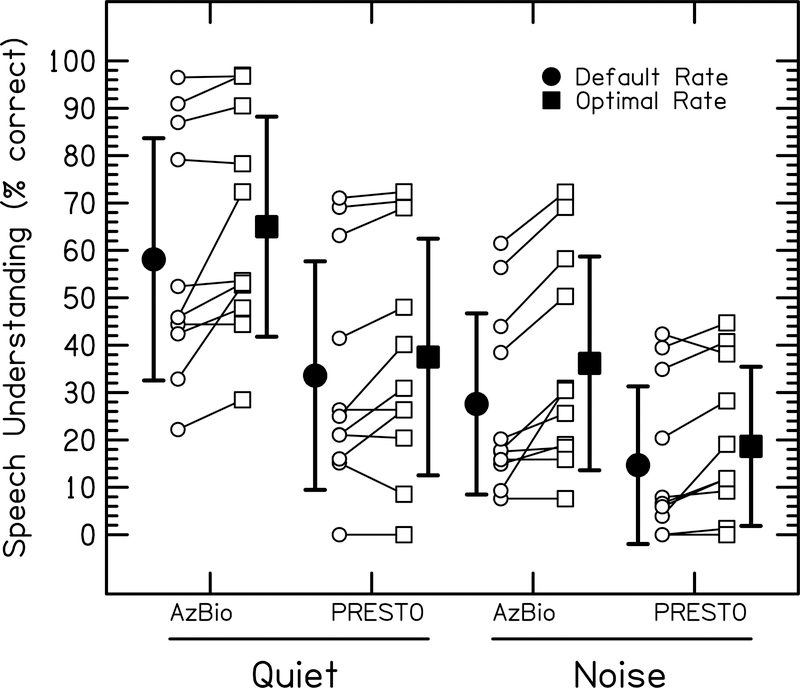
Figure 6:
Comparison of speech understanding scores using the default rate vs the optimal rate in each sentence condition for each of the 11 ears that showed an effect of stimulation rate. Optimal stimulation rate was defined as the rate that results in the highest average speech understanding scores for all sentence conditions. Thus, the optimal rate resulted in better performance overall, but could result in the same or slightly poorer performance for any single sentence condition. Open circles represent individual default-rate scores. Open squares represent individual optimal-rate scores. Filled circles represent group average scores with the default rates. Filled squares represent group average scores with the optimal rates. Error bars represent ±1 standard deviation.

