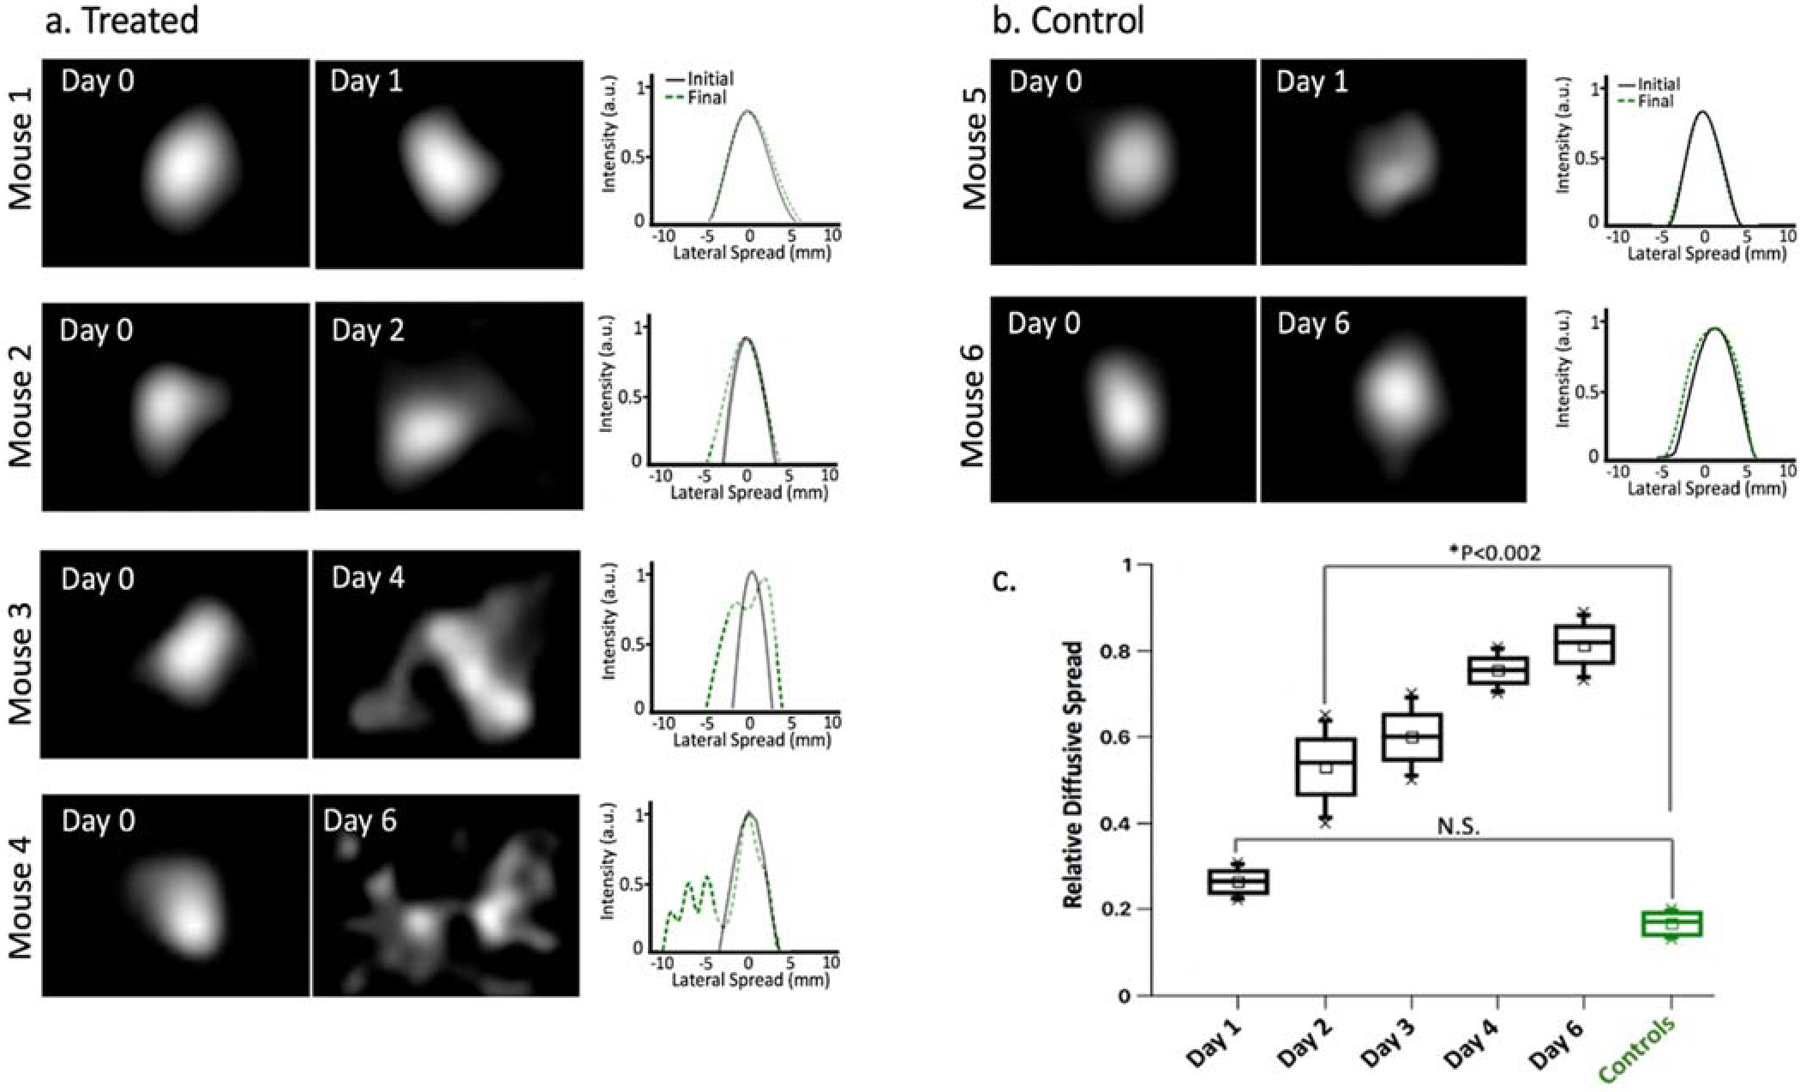
Figure 3-.

In vivo Cherenkov-excited imaging of phosphorescent dye injected into mice with A431 tumors. (a) In vivo phosphorescent images of four treated mice on Day 0 (acquired immediately after injection) compared to the final diffusive ink spread (acquired immediately before sacrificing) with the corresponding intensity profile plots shown to the right. (b) In vivo phosphorescent ink images and intensity profile plots for two control mice. (c) Boxplots summarizing the relative change in diffusive spread measured in mice grouped by day post-treatment (calculated using the full width at 20% maximum of the Day 0 profile plot as the reference value); abbreviations: N.S. = not significant, ** p-value <0.002
