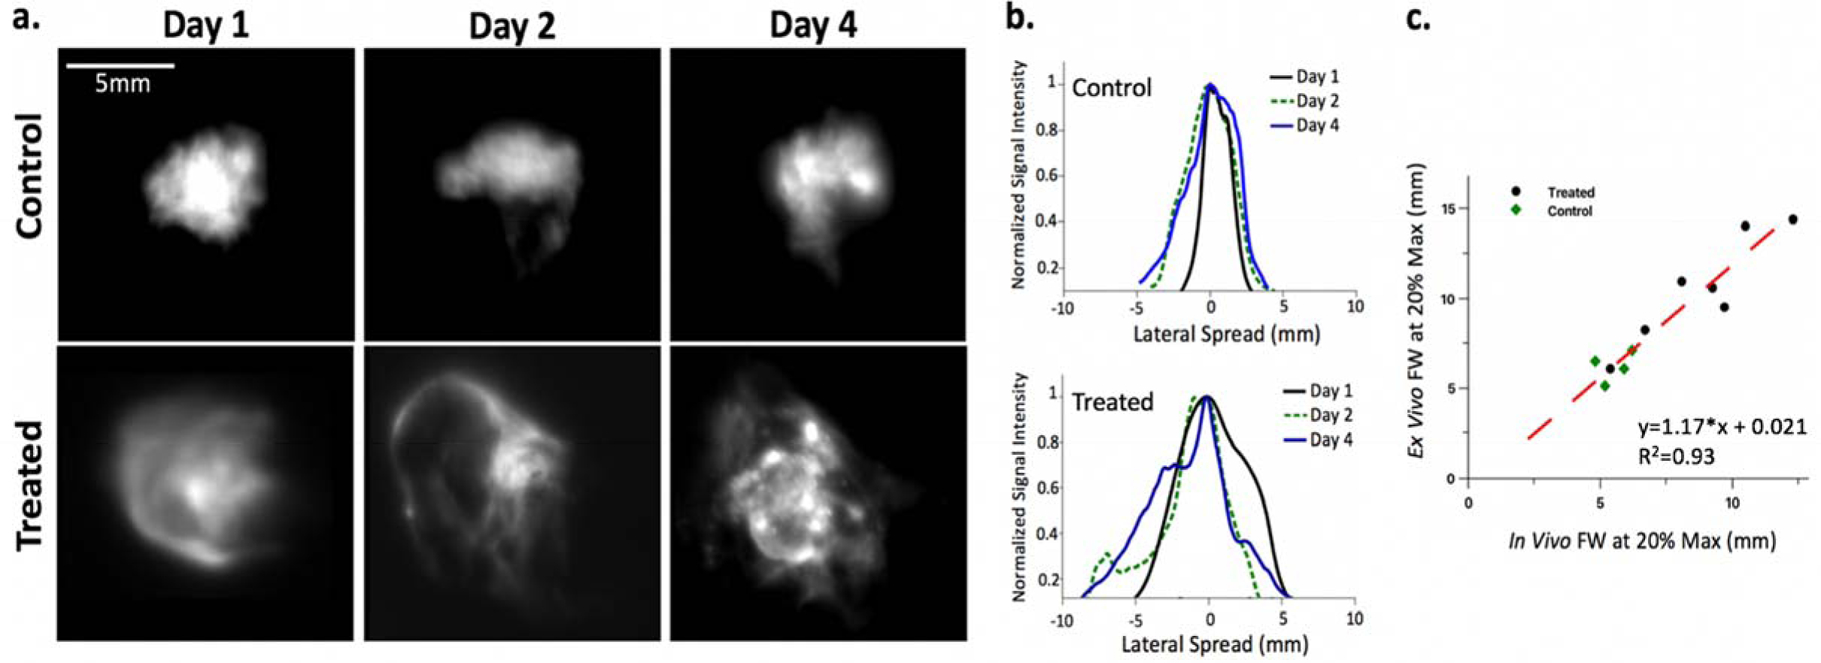
Figure 6 -.

(a) Z-projections of ex vivo image stack for 3 control and 3 treated tumors after one two and four days post injection, (b) corresponding profile spreads and (c) Ink diffusion as measured by full width at 20% maximum value of profile spread plots using the final in vivo Cherenkov-excited acquisition compared with the Z-project of the ex vivo cryo-fluorescence slice imaging; linear fit shown in red with R2=0.93.
