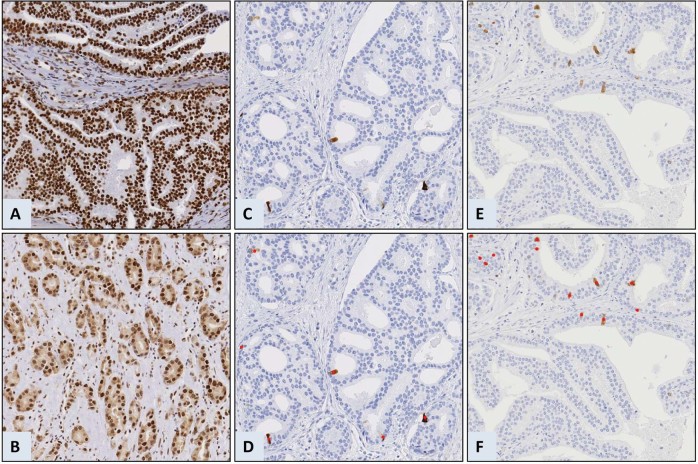
Fig. 2. Examples of protein labeling and scoring in tissue samples from prostate cancer.
Nuclear and cytoplasmic protein levels of mitotic checkpoint protein BUB3, cyclin B1 (CCNB1) and pituitary tumor-transforming 1 (PTTG1) was scored by assessing the whole tumor area. The tiles represent examples of (a) nuclear BUB3, (b) cytoplasmic and nuclear BUB3, (c) CCNB1, and (e) PTTG1 protein levels. Cells identified by ImmunoPath as positive are marked in red for (d) CCNB1 and (f) PTTG1. Negative cells are apparent by the blue counterstain of the nuclei. Each tile is 500 µm × 500 µm.

