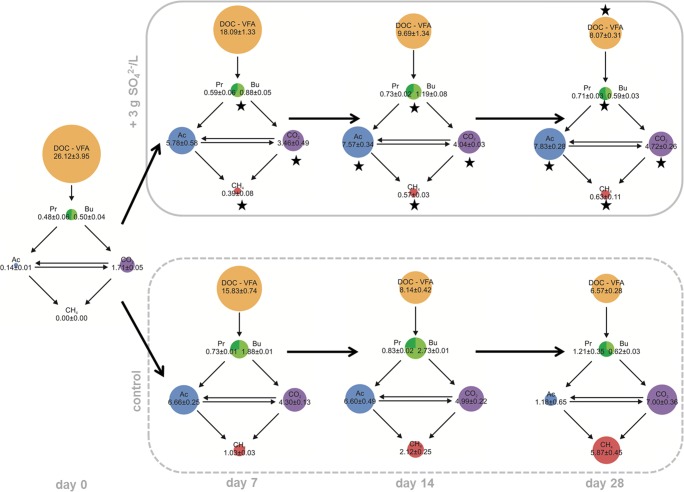
Fig. 6.
Carbon flow in samples with and without (control) 3 g SO42−/L during 28 days of anaerobic digestion (DOC dissolved organic carbon, VFA volatile fatty acids, Pr propionate, Bu butyrate, Ac acetate). The areas of the colored circles correspond to the amount of carbon in the specific fraction. Values are given in millimoles of carbon (mean ± standard deviation). Stars depict significant differences in the specific carbon fraction between the SO42−-samples and the controls at the same day

