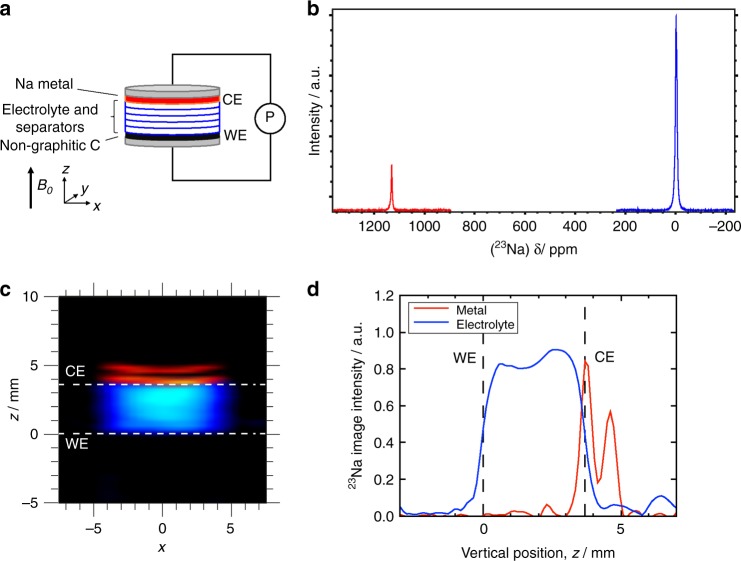
Fig. 1. 23Na NMR signal in a pristine sodium metal cell.
a Schematic diagram of the sodium metal cell with respect to the imaging coordinate system and the B0 magnetic field direction. The working electrode (WE) and counter electrode (CE) are connected to a potentiostat (P). b 23Na NMR spectra, acquired separately, for Na in the dielectric environment of the electrolyte (blue spectrum) and for the metallic Na (red spectrum). c 2D 23Na MRI of metallic (red) and dielectric (blue) sodium in the cell. The dashed lines indicate the positions of the sodium metal CE and carbon WE. d 1D 23Na MR profile of metallic (red) and dielectric (blue) sodium in the cell. This cell was assembled with five separators.

