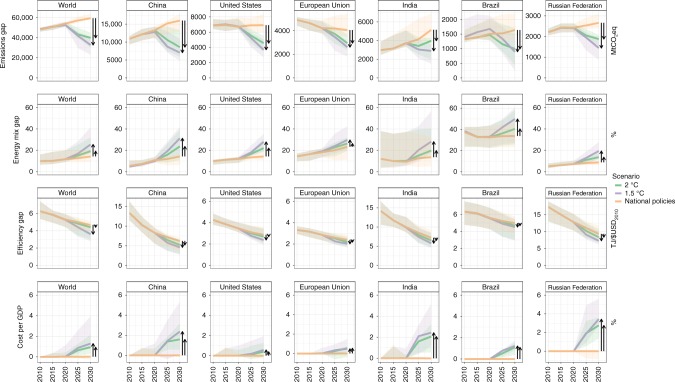
Fig. 3. Indicators derived from Kaya identity and costs per GDP between 2010 and 2030 on a global level and for seven large countries under different scenarios.
The median (lines) and 10th–90th percentile ranges (areas) from nine integrated global assessment models on emissions, energy mix and efficiency gaps and mitigation costs per GDP. These gaps are represented by total greenhouse gas emissions (MtCO2eq), low-carbon share of final energy (%), final energy intensity in GDP (TJ/USD2010) and total mitigation costs per GDP (%) between national policies and well below 2 °C scenarios. The data is available in the source data.

