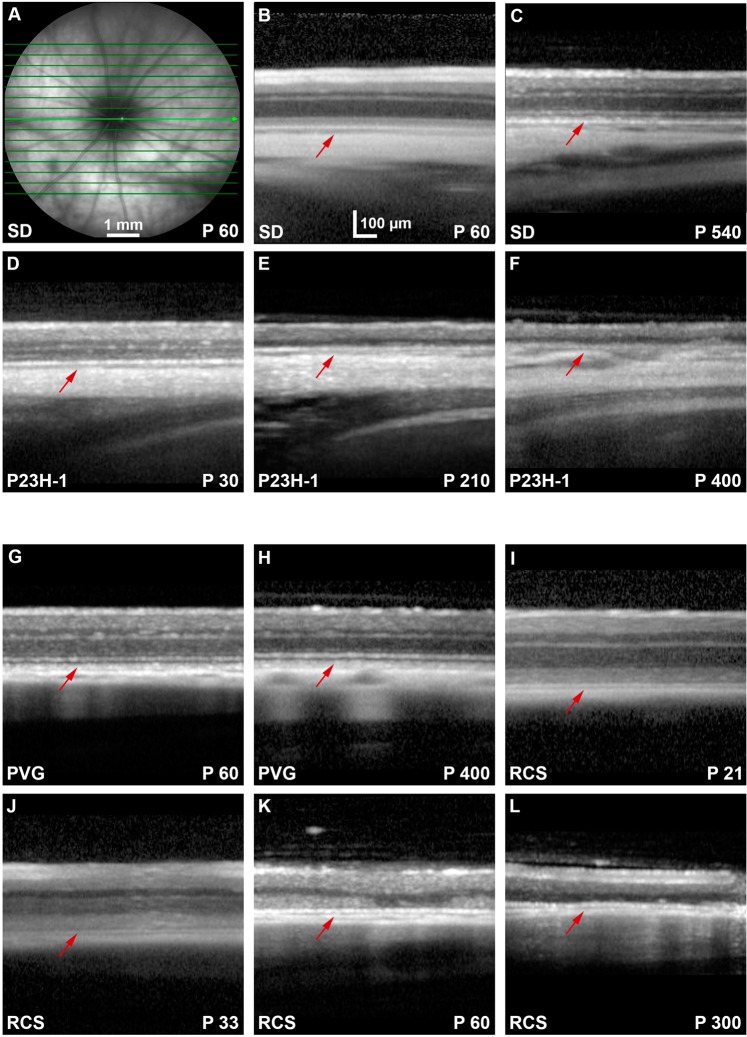
Figure 6.
OCT retinal sections in control, P23H-1 and RCS rats. (A) Ocular fundus image from a P60 SD rat. The green arrow marks the location of the OCT retinal sections shown in (B–L). (B–F) OCT retinal sections encompassing the optic disc acquired from young (B) and old (C) SD control rats, and 30 (D), 210 (E) and 400 (F) days old P23H-1 rats. (G–L) OCT retinal sections encompassing the optic disc acquired from young (G) and old (H) PVG control rats, and 21 (I), 33 (J), 60 (K) and 300 (L) days old RCS rats. In the dystrophic strains is observed that the outer retina diminishes with age. Red arrows point to the position of the RPE. P: postnatal day.

