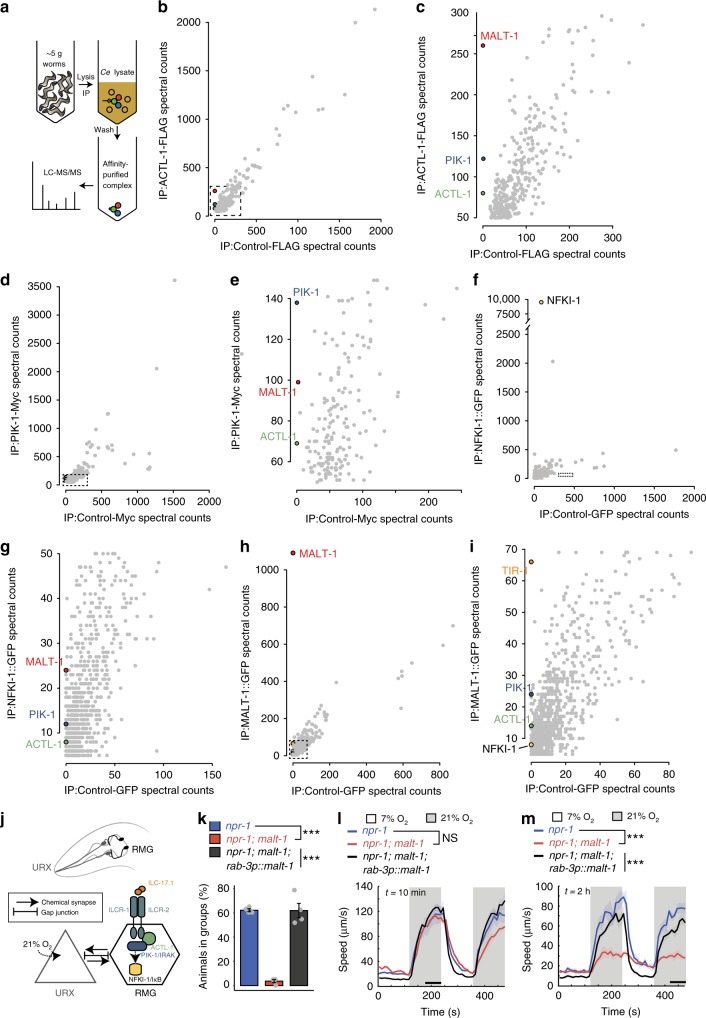
Fig. 1. MALT-1 forms a complex with ACTL-1, PIK-1/IRAK, and NFKI-1.
a Schematic for affinity-purification and LC-MS/MS analysis of epitope-tagged IL-17 signaling components from C. elegans extracts. Ce = C. elegans. b–i Pull-down of ACTL-1-FLAG, PIK-1-Myc, or NFKI-1::GFP specifically co-IPs MALT-1 (b–g). Conversely, pull-down of MALT-1::GFP specifically co-IPs ACTL-1, PIK-1, and NFKI-1 (h and i). Total spectral counts, a semi-quantitative readout of abundance22, are shown. c, e, g, and i as in b, d, f, and h except showing only the region marked by the black box in b, d, f, and h, respectively. f–i Data is representative of two (f and g), or three (h and i) biological replicates. j Schematic of IL-17 signaling in the O2-escape circuit. Increases in O2 levels are sensed by URX neurons, which tonically signal to RMG hub interneurons. IL-17 signaling increases the responsiveness of RMG neurons to promote escape from 21% O2. k malt-1 promotes C. elegans aggregation (N = 4 assays). Data are presented as mean values +/− SEM. ***P < 0.001, one-way ANOVA with Tukey’s post hoc HSD. l and m malt-1 mutants are strongly aroused by 21% O2 if stimulated immediately after transfer to the assay plate (l), but respond weakly to 21% O2 if allowed to settle over a 2 h period (m). l n = 86 animals (npr-1), n = 46 animals (npr-1; malt-1), n = 53 animals (npr-1; malt-1; rab-3p::malt-1). m n = 46 animals (npr-1), n = 72 animals (npr-1; malt-1), n = 46 animals (npr-1; malt-1; rab-3p::malt-1). Plots show average speed (line) and SEM (shaded regions). Time of assay after transfer is shown at top left. NS, P = 0.8, ***P < 0.001, two-sided Mann-Whitney U test. Here and in subsequent figures, black bars indicate time intervals used for statistical comparisons. See also Supplementary Figs. 1–4 and Supplementary Data 1.

