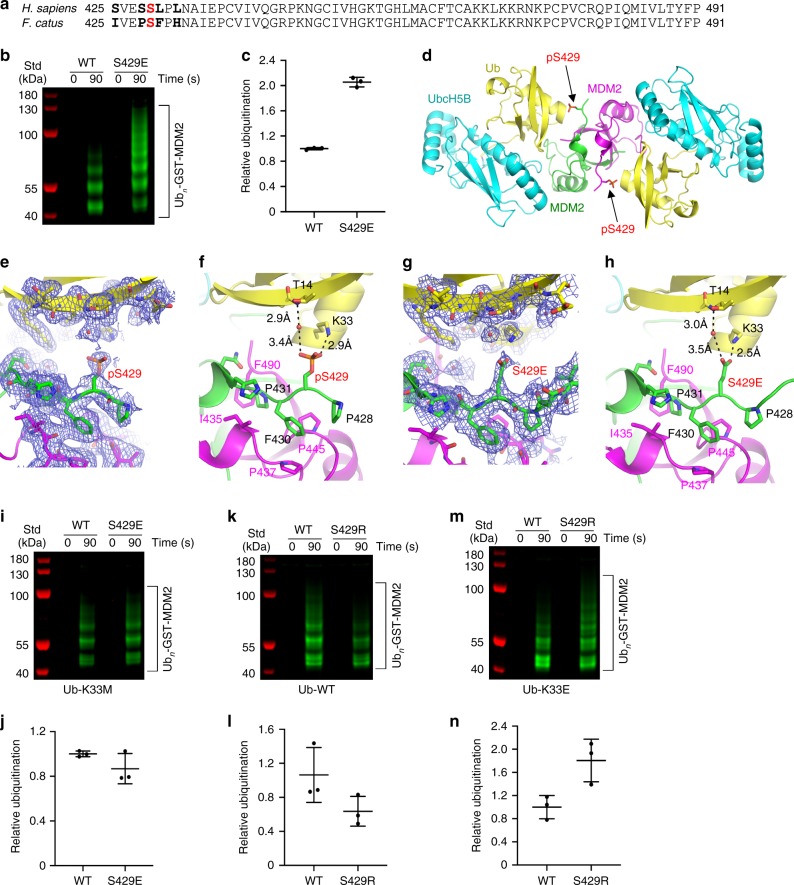
Fig. 4. Molecular basis of S429 phosphorylation.
a Sequence alignment of MDM2 RING domain from human and cat. S429 is colored red. The four non-identical residues between human and cat are highlighted in bold. b Reduced SDS-PAGE showing autoubiquitination reactions catalyzed by GST-cat-MDM2-422–C and its S429E substitution using fluorescently labeled Ub and visualized with an Odyssey CLx Imaging System. c Plot of relative ubiquitination activity of cat MDM2 variants in b. d Cartoon representation of the structure of cat MDM2-422–C-pS429 bound to UbcH5B–Ub shown in the same colors and orientation as in Fig. 2a (top panel). pS429 is indicated. e Close-up view of pSer429 in d with polder density map (blue) contoured at 1σ. f Close-up view of pS429-Ub interactions in d. g Close-up view of S429E in cat MDM2-422–C-S429E-UbcH5B–Ub structure (Supplementary Fig. 7a) with polder density map (blue) contoured at 1σ. h Close-up view of S429E-Ub interactions as in g. For e–h, key residues are shown as sticks and colored as in Fig. 3. Phosphorus atoms are in orange. The water molecule is depicted as a red sphere. Hydrogen bonds are shown as dashed lines and the distances are indicated. i, k, m Reduced SDS-PAGE showing autoubiquitination reactions catalyzed by GST-MDM2-419–C variants using indicated fluorescently labeled Ub variants visualized with an Odyssey CLx Imaging System. j, l, n Plots showing the relative ubiquitination activity of MDM2 variants in i, k, m. In c, j, l, n, data are presented as mean value ± SD from three independent experiments (n = 3). All uncropped gel images and InstantBlue-stained gels are shown in Supplementary Fig. 5b–e.

