
Fig. 1.
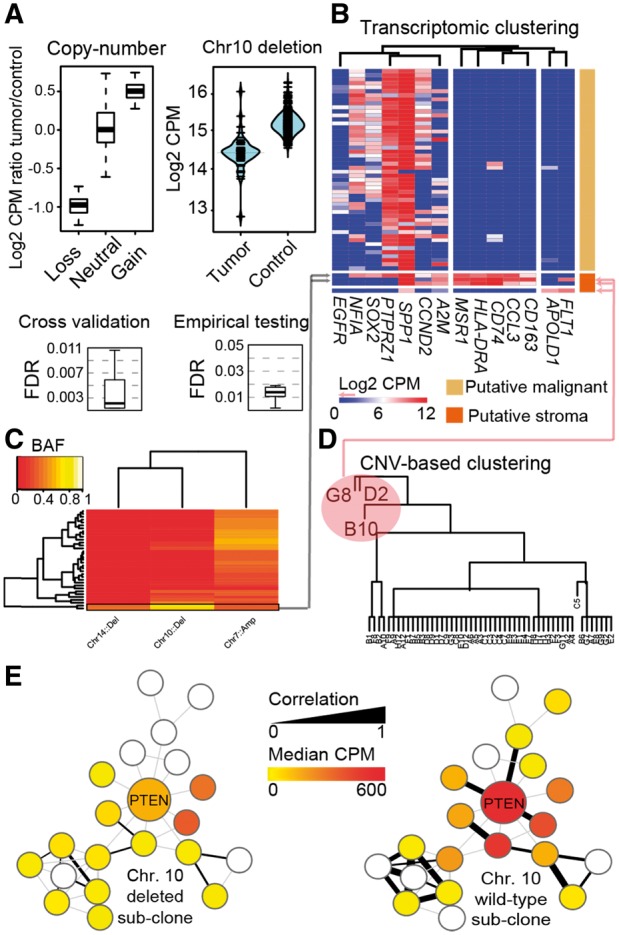
An example of CONICS analysis on scRNA-seq and exome-seq of a glioblstoma biopsy. (A) CONICS quantifies CNVs in single cells with a controlled error rate: ScRNA-seq read-count correlations with CNV status (top left); scRNAseq read-count distributions for an example CNV (top right); FDR estimates in assigning CNV status to individual cells, computed via cross validation (bottom left) and via comparison to a control dataset (bottom right). (B–D) CONICS estimates CNV allele frequency, which, when compared to the expression of canonical markers and clustering of CNV status, enables the rigorous separation of stromal /immune cells from neoplastic cells. (E) Co-expression network of PTEN, produced by CONICS, compared between cells with a chr. 10 loss and wild-type