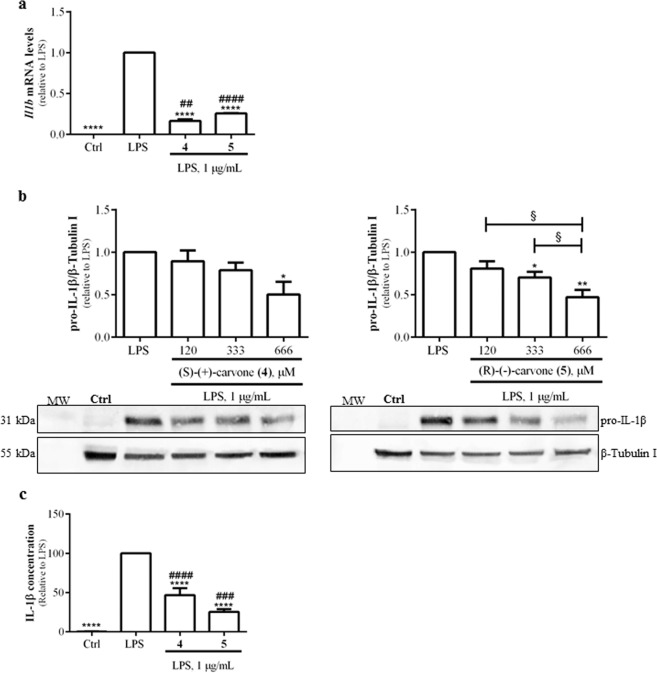
Figure 3.
(S)-(+)-carvone (4) and (R)-(−)-carvone (5) decrease LPS-induced IL-1β mRNA (a) and protein (b,c) levels in the Raw 264.7 cell line. Macrophage cultures were treated with 1 µg/mL LPS, for 6 h (a) or 18 h (b,c), following pre-treatment for 1 h with 666 µM of each test compound (a and c) or with the concentrations indicated in (b). Control cells (Ctrl) were treated with vehicle (0.1% DMSO) in the absence of LPS. Each column represents the mean ± SEM of, at least, three independent experiments. The blots shown are representative of, at least, three independent experiments and are cropped for clarity and conciseness. The corresponding full-length blots are presented in Fig. S3. *p < 0.05, **p < 0.01 and ****p < 0.0001 relative to LPS-treated cells. ##p < 0.01, ###p < 0.001 and ####p < 0.0001 relative to the Ctrl. §p < 0.05 between the conditions indicated. MW: molecular weight marker.

