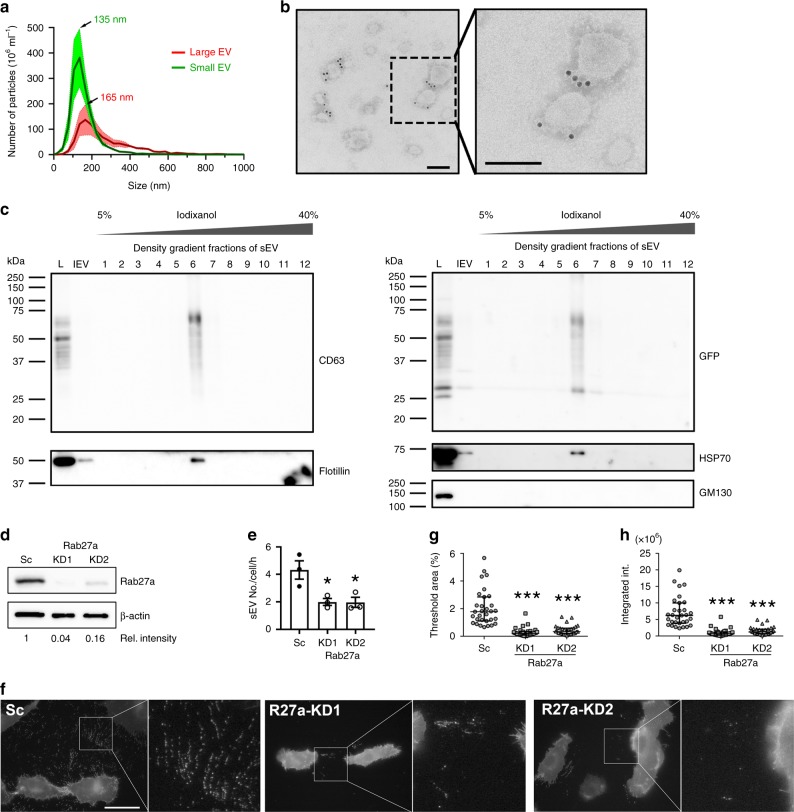
Fig. 2. pHluo_M153R-CD63 labels exosomes.
a Averaged trace from nanoparticle tracking analyses of large EVs (red) and small EVs (green) secreted from pHluo_M153R-CD63-expressing HT1080. Shaded area represents s.e.m. from three independent experiments. Small EVs were purified through iodixanol density gradient. b Representative immunogold negative stain electron micrograph of small EVs iodixanol density-gradient-purified from pHluo_M153R-CD63-expressing HT1080 from two independent experiments. Scale bars, 100 nm. c Western blot analysis of cells and EVs with anti-CD63, anti-GFP, EV markers (Flotillin, HSP70) and Golgi marker (GM130). L total cell lysate, lEV large EV, sEV small EV. d Immunoblotting of Rab27a in pHluo_M153R-CD63-stably expressing HT1080. Sc scrambled control, KD knockdown. e Comparison of small EV (sEV) secretion rate between control and Rab27a-KDs shown as a scatter-plot (mean ± standard error) from three independent experiments. *P = 0.030793 and 0.031077 for Rab27a-KD1 and KD2, respectively, by two-sided paired Student’s t test. f−h Live imaging and analysis of extracellular pHluo_M153R-CD63 for control and Rab27a-KD cells. f Representative images, n = 31 images from three independent experiments for each cell line. R27a, Rab27a. Scale bar, 30 µm. g Threshold area of the extracellular region from (f) shown as a scatter-plot (median and quartile range). ***P < 0.001 by two-sided unpaired Mann−Whitney U test. h Integrated intensity of the extracellular region from (f) shown as a scatter-plot (median and quartile range). ***P < 0.001 by two-sided unpaired Mann−Whitney U test. Source data are provided as a Source Data file.

