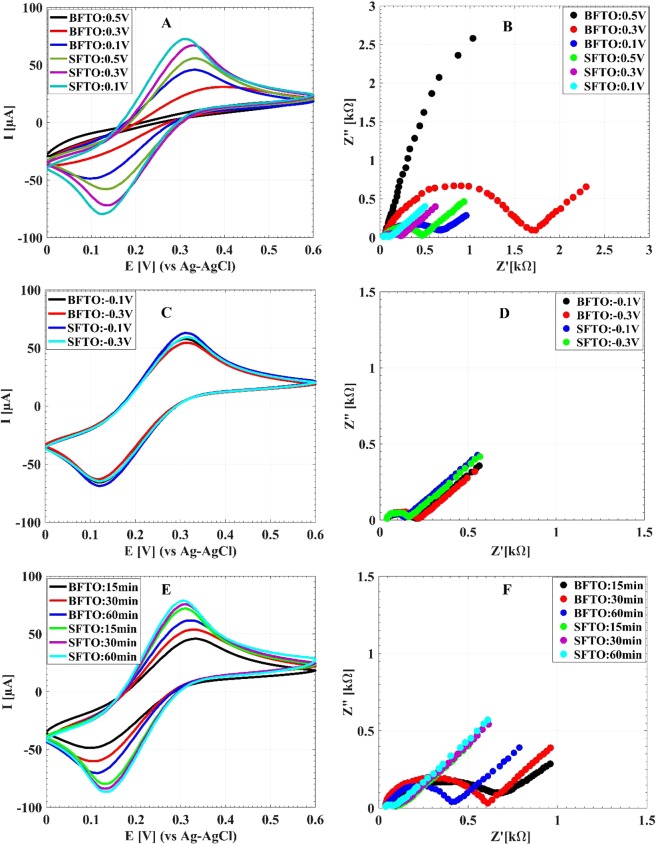
Figure 6.
The CV and EIS responses of the BFTO and the SFTO after electrodeposition of AuNSs. Graphes A and B display the CV and EIS responses of AuNSs grown during 900 s with different positive deposition potentials. Graphes C and D display the CV and EIS results for the 900 s growth of AuNSs with various negative deposition potentials. Graphes E and F display the CV and EIS results for the optimum deposition voltage of 0.1 V with various deposition times.

