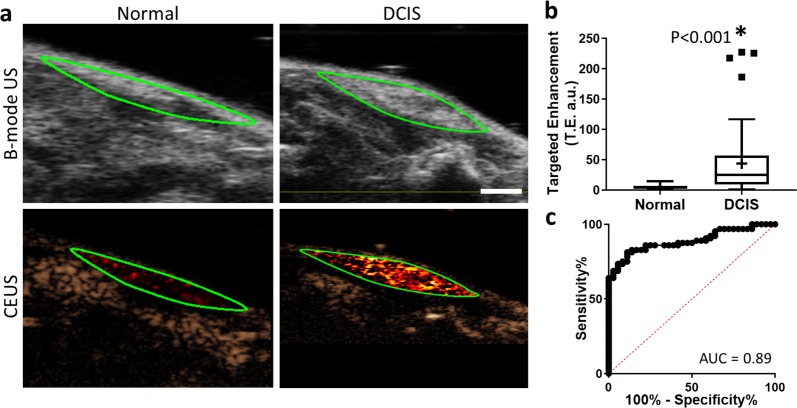
Fig. 4. Contrast-enhanced molecular ultrasound (CEUS) imaging of B7-H3 expression in normal mammary glands and DCIS with B7-H3 targeted microbubbles (MBB7-H3).
a Representative B-mode (top) and CEUS (bottom) images of murine mammary glands with either normal (left) or DCIS (right) tissues (green outline) enhanced with MBB7-H3. Scale bar = 2 mm. b Box plot of targeted enhancement (T.E., a.u.) of normal mammary glands (n = 36, TE = 5.0 ± 3.5 a.u.) and DCIS (n = 64, TE = 44.2 ± 53.3 a.u.). Box plot follows Tukey rules. Glands containing DCIS show statistically significantly higher CEUS signal with B7-H3 targeted microbubbles (P < 0.001). c Receiver operating curve depicting the ability of B7-H3 expression and CEUS with MBB7-H3 to differentiate between normal murine mammary glands and glands containing DCIS (AUC = 0.89, 95% CI 0.82, 0.95).

