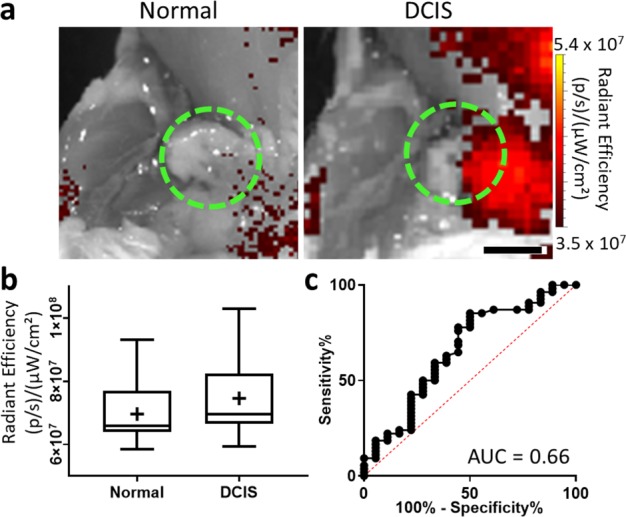
Fig. 6. Fluorescence molecular imaging of a B7-H3 antibody-ICG conjugate (B7-H3-ICG) in normal murine mammary glands and glands containing DCIS.

a Representative fluorescence images of murine mammary glands with either normal (left) or DCIS (right) tissues (green dashed circles) after injection with (B7-H3-ICG). Scale bar = 3 mm. b Box plot of fluorescence imaging signal (radiant efficiency (RE), (p/s)/(µW/cm2)) distribution of normal mammary glands (n = 18, RE = 7.0 × 10⁷ ± 1.0 × 10⁷ (p/s)/(µW/cm2)) and DCIS (n = 54, RE = 7.5 × 10⁷ ± 1.1 × 10⁷ (p/s)/(µW/cm2)). Box plot follows Tukey rules. Glands containing DCIS do not show statistically significantly higher sPA signal (P = 0.09). c Receiver operating curve depicting the ability of B7-H3 expression and fluorescence molecular imaging with B7-H3 Ab-ICG to differentiate between normal glands and glands harboring DCIS (AUC = 0.66, 95% CI 0.51, 0.81).
