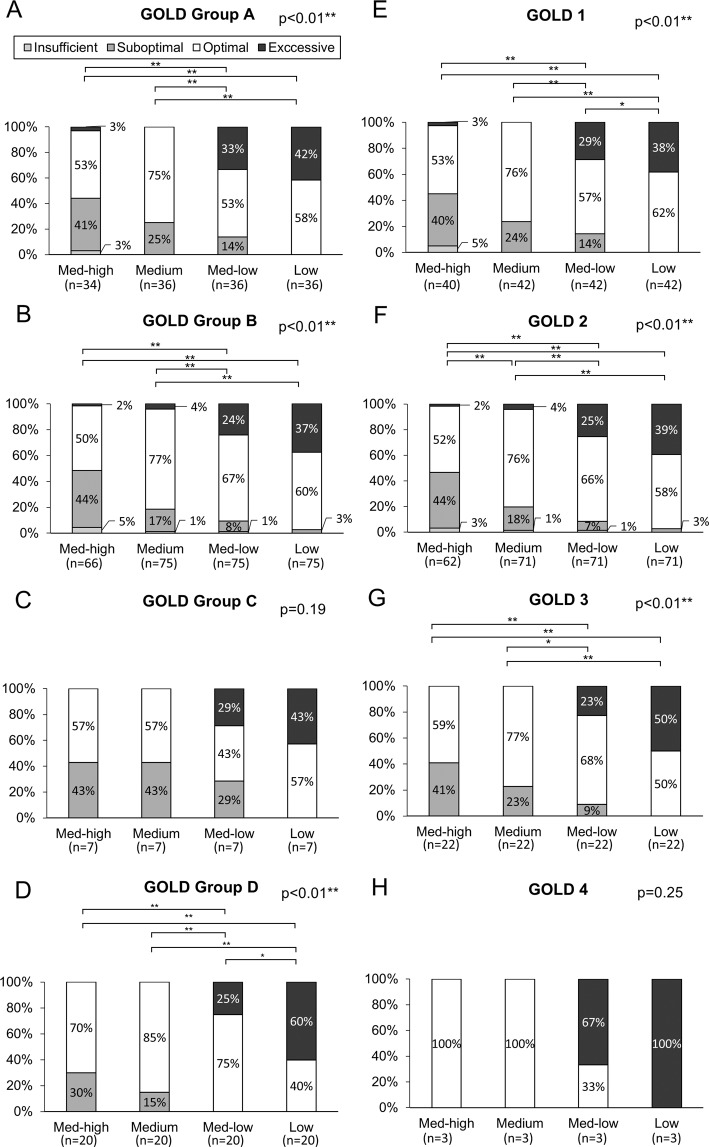
Figure 5.
Percentage of excessive, optimal, suboptimal and insufficient peak inspiratory flow rates measured against different resistances among patients with Global Initiative for Chronic Obstructive Lung Disease (GOLD) group A (Panel A, p < 0.01), group B (Panel B, p < 0.01), group C (Panel C, p = 0.22), group D (Panel D, p < 0.01) and GOLD stage 1 (Panel E, p < 0.01), stage 2 (Panel F, p < 0.01), stage 3 (Panel G, p < 0.01) and stage 4 (Panel H, p = 0.045). * represents p < 0.05; ** represents p < 0.01.

