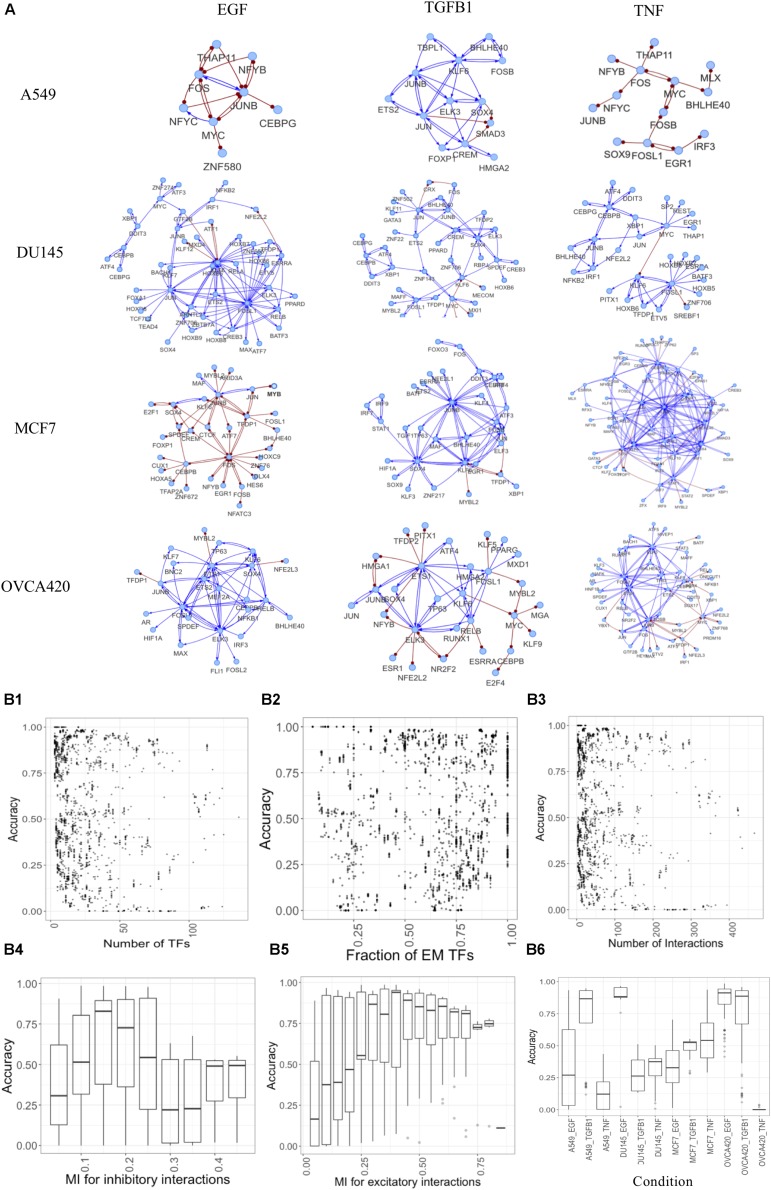
FIGURE 6.
Constructing context-specific gene regulatory networks. (A) Representative networks yielding high accuracy scores for various conditions. Activating interactions denoted as blue arrows and inhibitory interactions as red round-tipped arrows. (B) Accuracy dependence on various network properties for all conditions. (B1–B3) Points showing accuracy (measured as fraction of models that can be classified as E or M) of models for various (B1) number of TFs in the network, (B2) fraction of TFs assigned as E or M using experimental data, (B3) number of interactions in the network. (B4–B6) Box plots showing accuracy of networks for various (B4) mutual information cutoffs for inhibitory interactions, (B5) mutual information cutoffs for excitatory interactions, (B6) different experimental conditions.

