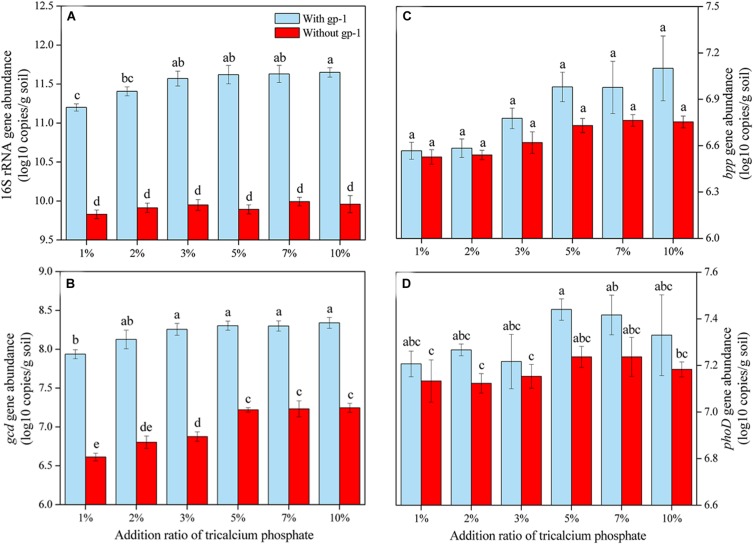
FIGURE 5.
The abundances of 16S rRNA gene (A), gcd gene (B), bpp gene (C), and phoD gene (D) in soils with different addition rate of tricalcium phosphate. The results are the mean value of three replicates, error bars represent standard error. The lowercase letters above the columns denote significant level (P < 0.05).

