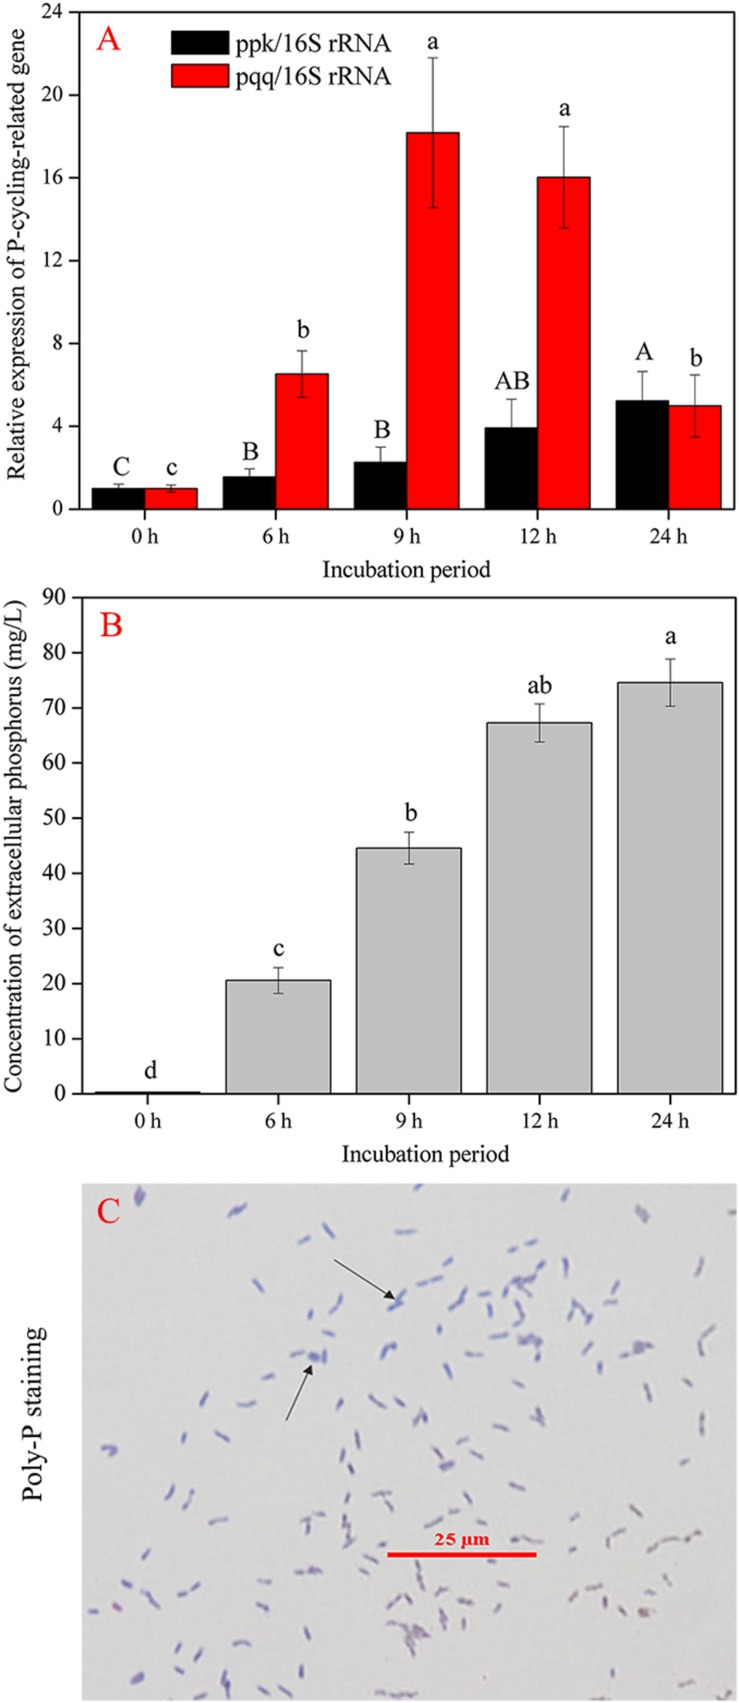
FIGURE 7.
Gene abundance and phosphorus determination during 24 h. (A) shows the shift in P-cycling-related gene abundance. (B) reflects the concentration of extracellular phosphorus. (C) shows the granular staining. The results are the mean value of three replicates, error bars represent standard error. The lowercase letters above the columns denote significant level (P < 0.05).

