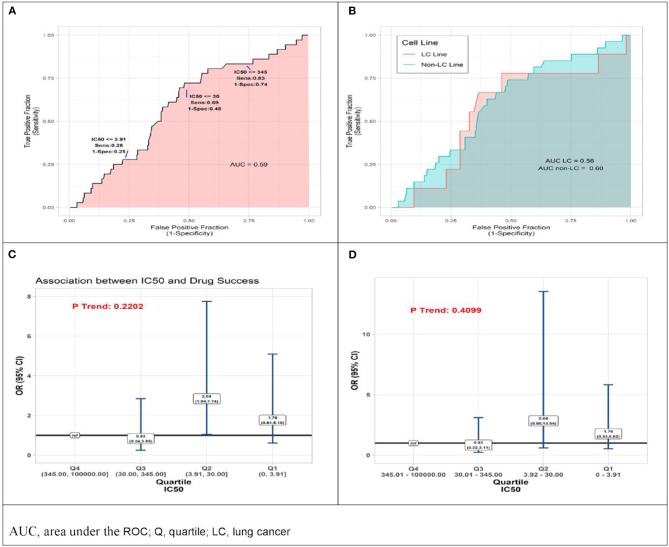
Figure 2.
Results of quantitative analyses of preclinical cell line experiments. (A) Receiver operator curves (ROC) displaying accuracy of IC50 value as predictor of drug approval for all cell line experiments combined, and (B) within subsets defined by type of cell line, lung cancer cell lines (pink) non-lung cancer cell lines (aqua). (C) Odds Ratio (OR) associations between drug success and quartile of IC50 result of preclinical cell model experiment, drugs with IC50 in lower quartiles (Q) Q1, Q2, Q3 compared to those with IC50 in highest quartile, Q4 (reference) by two analytic methods, conventional logistic regression, and (D) General Estimating Equation (GEE), allowing for non-independence of multiple experiments using the same drug.

