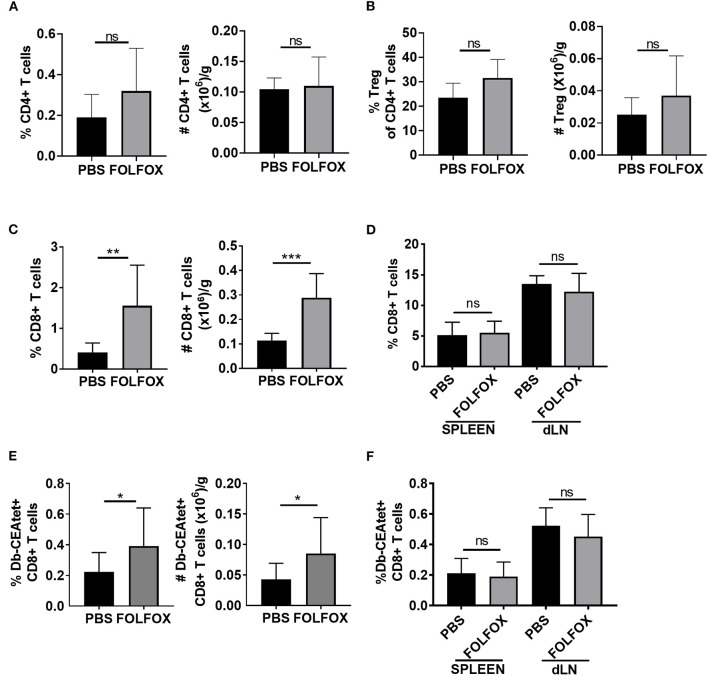
Figure 3.
FOLFOX treatment is associated with an increase in tumor antigen-specific CTLs. Phenotypic identification of tumor-infiltrating lymphocytes subsets harvested 4 days after the third treatment in experiments performed as in Figure 1 by flow cytometry. (A) CD4 T cells, (B) regulatory T cells or Treg (CD4+CD25+FoxP3+), and (C) CD8 T cells are presented as the frequency and absolute number per gram of tumor tissue. (D) Spleen and dLN in MC38-CEA2 tumor-bearing mice were analyzed for CD8 T cell frequency. (E,F) Tumor antigen-specific CTLs were gated on CD8+CD44+Db-CEAtet+. Graphs show the frequency (over live gate) and number of CEA specific CD8 T cells in tumor (E) and the frequency of CEA specific CD8 T cells in spleen and dLN (F) in untreated (PBS) and FOLFOX treated mice. Representative data of n≥3 experiments with each group containing 4–6 mice. *p < 0.05, **p < 0.01, ***p < 0.001.

