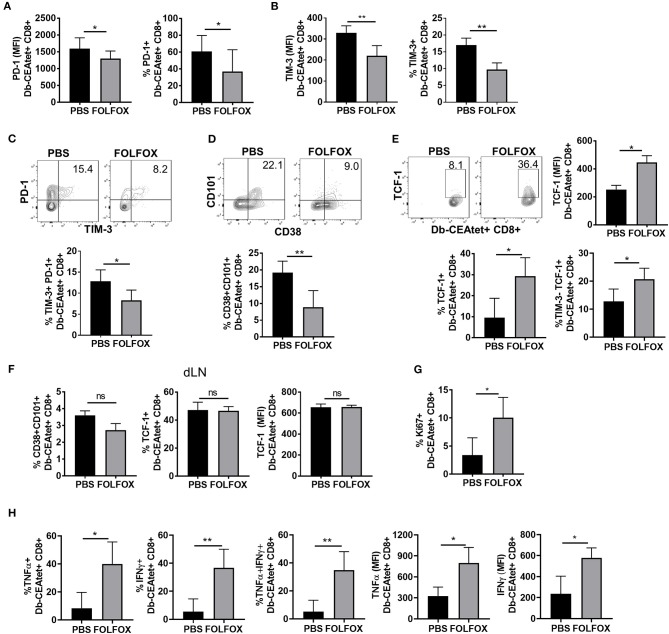
Figure 5.
Upon FOLFOX treatment, TILS are phenotypically less exhausted and more functional. Tumor antigen specific CD8 T cells from PBS or FOLFOX treated animals harvested 4 days after the third treatment were analyzed for indicated phenotype. Tumor antigen specific CD8 T lymphocytes were gated on CD8+CD44hiDb-CEAtet+ population. Graphs show frequency of tumor antigen specific CD8 T cells that are positive for the expression of PD-1 (A) or TIM-3 (B) or both (C). Levels of PD-1 (A) and TIM-3 (B) expressed by tumor antigen specific CD8 T cells were assessed by MFI in flow cytometry analysis. (C) Representative flow cytometric analysis of PD-1 and TIM-3 expression of CEA specific TILs where numbers indicate %. (D–F) Representative flow cytometric analysis of CD38, CD101, and TCF-1 expression of CEA specific TILs where numbers indicate %. Graphs show frequencies of terminally exhausted (CD101+CD38+CD8+ Db-CEAtet+) (D) or TCF-1 positive CD8 T cells (TCF-1+Db-CEAtet+CD8+) or “progenitor exhausted” phenotype (TIM-3-TCF1+Db-CEAtet+CD8+) or levels of TCF-1 (MFI) (E) in tumor antigen specific CD8 T cells over control levels. (F) Exhaustion phenotype in tumor antigen specific CD8 T cells in draining lymph nodes. (G) Tumor antigen specific CD8 T cells were analyzed for expression of Ki67. Cells were first gated on CD8+ CD44+ Db-CEA tetramer+ Ki67+ based on its isotype control staining. (H) Tumor cells were re-stimulated with PMA and ionomycin for 5 h in the presence of Golgiplug for ex vivo T cell function analysis. Graphs show frequency of CEA antigen specific CD8 T cells that are positive for the expression of the cytokine indicated and levels of the cytokines. Representative data of ≥3 with each group containing 4–6 mice. *p < 0.05, **p < 0.01.

