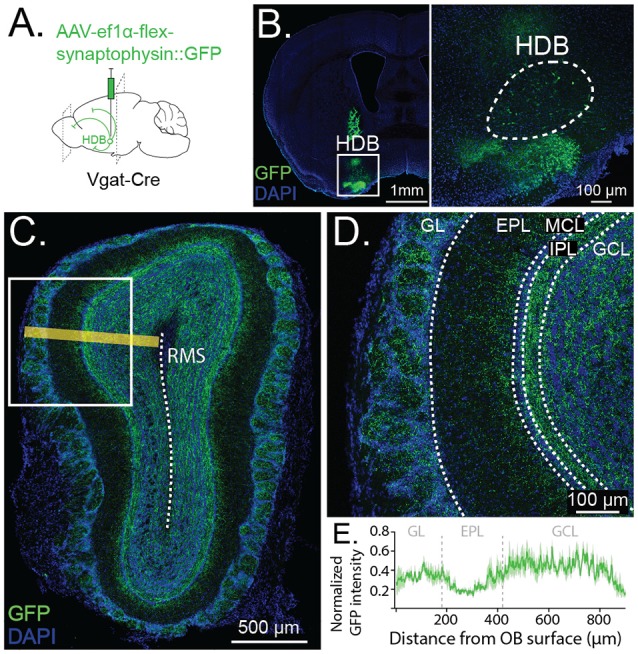
Figure 2.

Anterograde tracing reveals GABAergic projections from HDB to GCL and glomerular layer (GL). (A) Schematic depicting viral injection of Cre-dependent synaptophysin fused to GFP (AAV-Ef1α-flex-synaptophysin::GFP) and anterogradely-labeled projections in Vgat-Cre-expressing mice. (B) Coronal section showing viral injection site and synaptophysin::GFP expression in HDB. Inset shows cell bodies expressing GFP in HDB (dashed lines) (C). Anterograde labeling in OB with yellow line demonstrating orientation of the line scan plane from the OB surface to the rostral migratory stream (RMS, dashed line) for quantification of GFP intensity (shown in E). (D) Synaptophysin::GFP expression is dense throughout the GCL and GL, highest in the internal plexiform layer (IPL) and lowest in the external plexiform layer (EPL). (E) Quantification of GFP intensity along a line scan from the OB surface to 900 μm deep toward the RMS (shown in C). The dark green trace shows GFP intensity peak-normalized by the animal, averaged across five same-sized sections from five animals. The light green band shows SE. Dashed vertical lines show approximate borders of GL, EPL, and GCL.
