Figure 1.
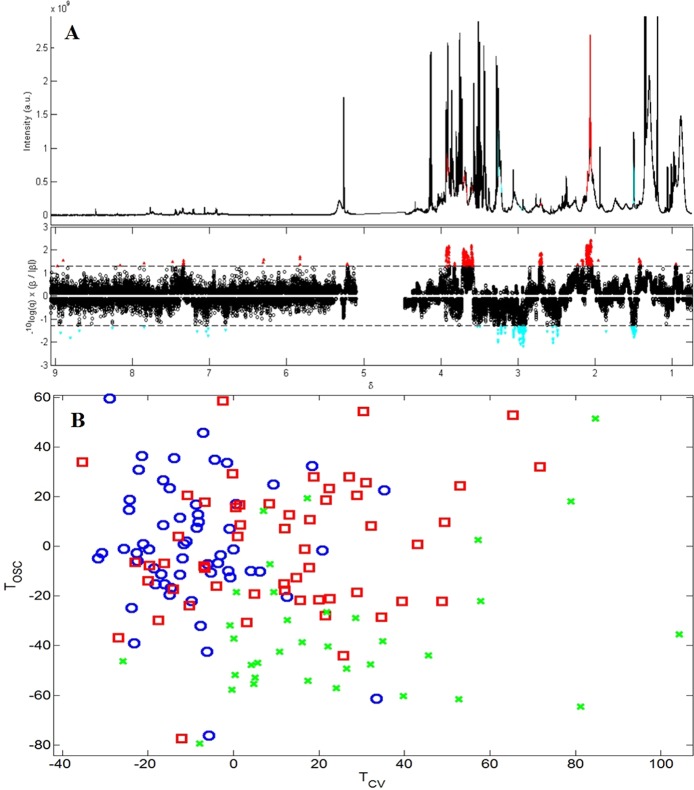
OPLS-DA model based on 1H NMR spectroscopy data, with 500 model iterations, separating Gambian infants at enrolment based on diagnosis, R2Y = 0.78, Q2Y = 0.30, n = 93 (one sample was excluded as there was no information on the participant’s weight, and another was excluded as it was an outlier). (A) The upper panel shows the median 1H spectra of the serum, with peaks which were statistically significantly different between the two groups highlighted. Peaks in red were found in higher concentrations in the TB disease group, while peaks in blue were found in increased concentrations in the other diseases group. This was plotted for easier identification of the peaks and their corresponding metabolites. The lower panel displays a skyline significance plot of significant variables discriminating between the groups. Variables in red above the dashed line are statistically significantly increased in samples from the TB disease group, the strength of the correlation is displayed by the distance from the dashed line, with variables further away being more strongly associated with that group. Variables in blue below the dashed line are the variables increased in the other diseases group (or found in lower concentrations than in the TB disease group). (B) OPLS-DA scores plot, displaying the correlations in the 1H spectra between the participants (the closer the scores are the more similar these participants 1H NMR spectra are to one another). Red squares represent the TB disease group, blue circles represent the other diseases group, and green crosses represent the validation group samples.T orthogonal signal correction, TOSC; T cross validation, TCV.

