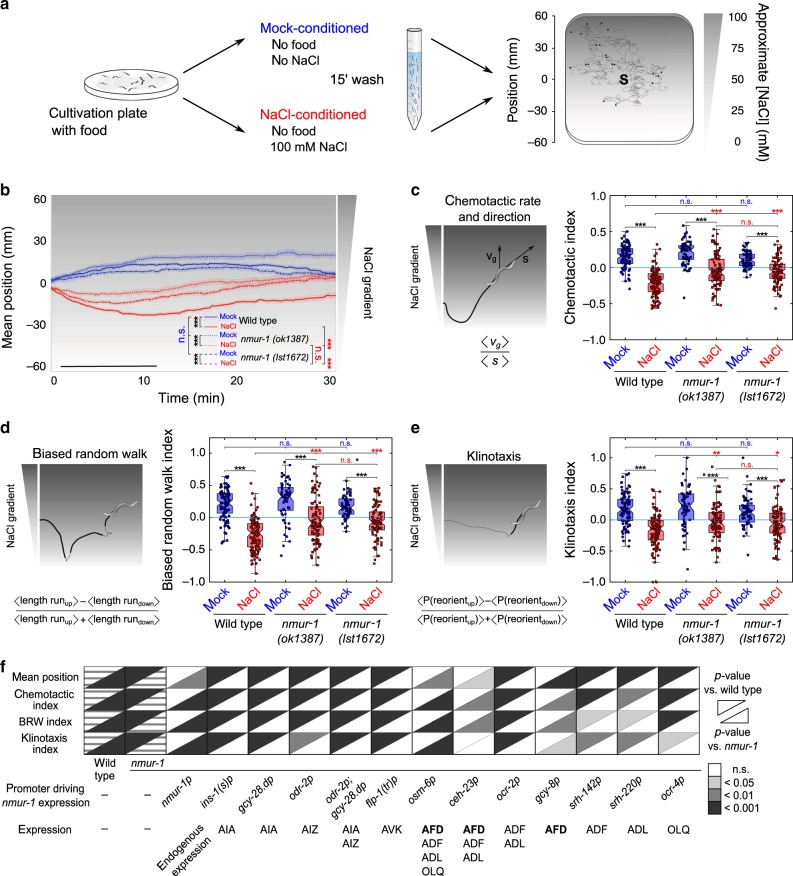
Fig. 3. NMUR-1 signaling in AFD modulates distinct behavioral strategies underlying learned salt avoidance.
a Tracking setup for measuring gustatory aversive learning on NaCl gradients. NaCl chemotaxis behavior is monitored on 0 to 100 mM linear NaCl gradients. Conditioned worms are released from the gradient’s center (S, source) and allowed to navigate for 30 min. Tracking software extracts positional data and determines behavioral indices for forward movement and turning behavior relative to the gradient. b Average positions of wild type, nmur-1 (ok1387) and nmur-1 (lst1672) mutants on the linear NaCl gradient through time after mock- and NaCl-conditioning. In this and all subsequent figures, black bars indicate the time interval used for statistical comparison of the mean position on the gradient, and for calculating chemotactic, biased random walk and klinotaxis indices. Shaded regions represent S.E.M. c The chemotactic index quantifies the preferential migration vector of each individual and is calculated as the ratio between the mean velocity of an individual trajectory along the gradient direction ‹vg› and the mean crawling speed ‹s›. d Quantification of biased random walk behavior, assessing the relative duration of forward runs when navigating up the salt gradient per worm. e The klinotaxis index reflects the behavioral strategy by which worms actively steer towards attractive NaCl concentrations, quantified as the fractional difference in the relative probabilities of turns reorienting individual animals up or down the gradient. b–e From left to right n = 92, 110, 64, 92, 66, 87 animals per condition. f Summary statistics of rescue experiments for nmur-1 learned salt aversion defect. For each of four behavioral parameters, significances are relative to NaCl-conditioned wild-type and nmur-1 (ok1387) animals. Raw data on Supplementary Figs. 4 and 5. Statistical analysis by two-way ANOVA and Tukey’s HSD post hoc test in b–e, and one-way ANOVA with Tukey’s post hoc test or two-sided Kruskal–Wallis with Dunn’s post hoc test if one of the conditions was not normally distributed in f. n.s. not significant; *p ≤ 0.05; **p ≤ 0.01; ***p ≤ 0.001. Boxplots show medians, 25th and 75th percentiles as box limits. Whiskers extend to the most extreme data points not considered as outlier.

