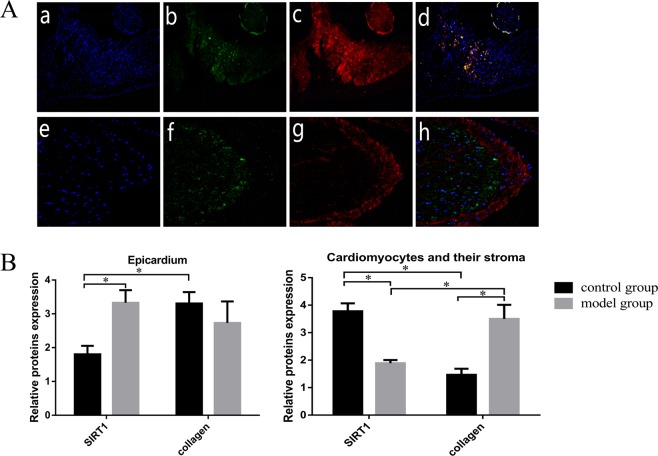
Figure 2.
Immunofluorescence confocal microscopy showed the SIRT1 and collagen I protein expression profiles. The collagen I protein is represented by vimentin staining (red), the SIRT1 protein is represented green staining, and the nuclei are represented by DAPI staining (blue). (A) DAPI staining (a), SIRT1 (b), collagen I (c) and the merged figure (d) in the model group; DAPI staining (e), SIRT1 (f), collagen I (g) and the merged figure (h) in the control group. (B) Quantitative analysis of SIRT1 and collagen I expression in the cardiomyocytes and the epicardium. *P < 0.05.

