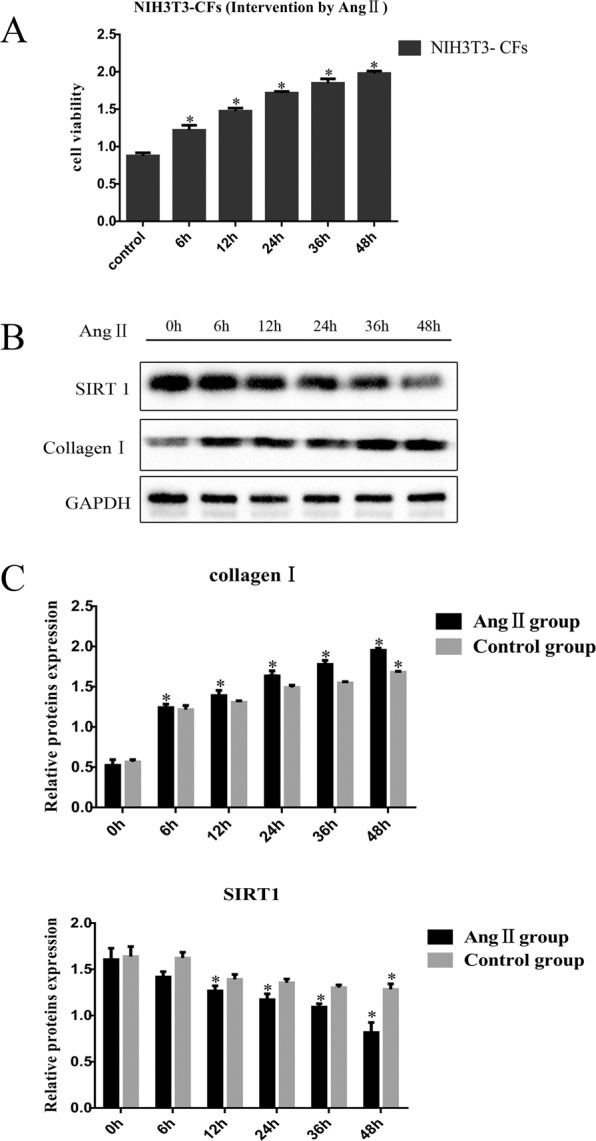
Figure 5.

Cell activity and protein expression in the NIH3T3 fibroblasts after treatment with Ang II. (A) MTT analysis showed that cell viability increased gradually 0, 6, 12, 24, 36, and 48 h after treatment with Ang II. (B and C) Collagen I expression gradually increased 0, 6, 12, 24, 36, and 48 h after Ang II treatment, and SIRT1 expression gradually decreased, as determined by Western blotting. Cropped gels are used for presentation. Full-length blots are presented in Supplementary Figure 9–11. *P < 0.05.
