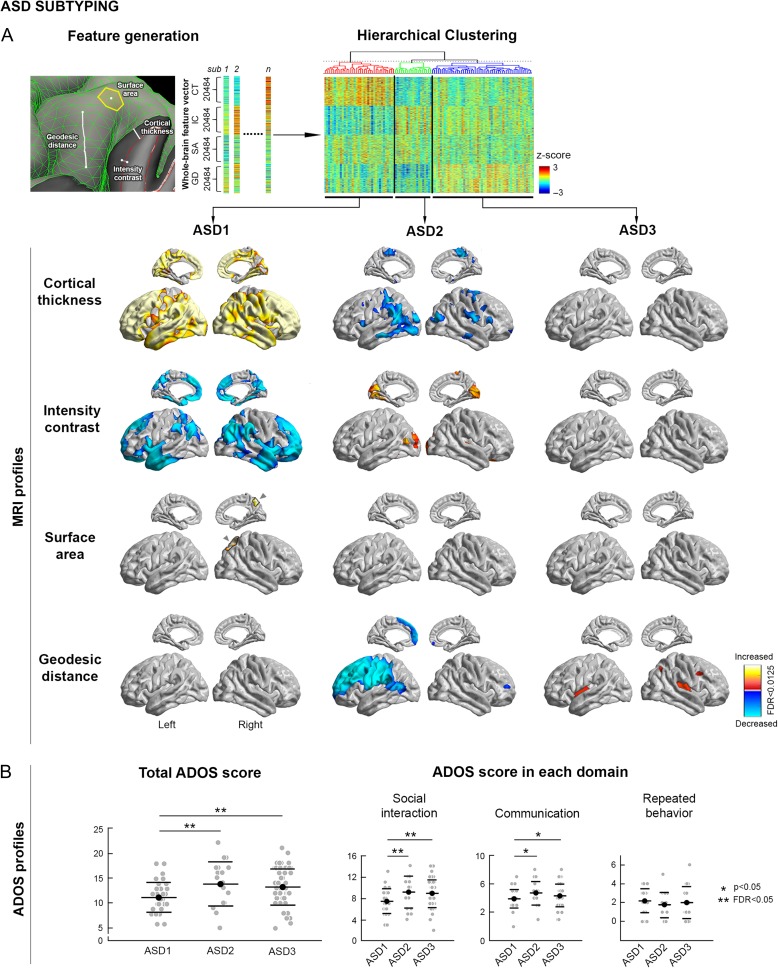
Figure 1.
ASD subtyping. (A) Top: The 4 MRI-based features (cortical thickness, surface area, intensity contrast, geodesic distance) used for subject-wise profiling. Bottom: Three classes (ASD-I, II, III) optimally described our multi-centric cohort. Features are corrected for age and site effects. Shown are differences in MRI features compared to controls (increases/decreases in red/blue). Cortex-wide significances were corrected using the false discovery rate procedure, furthermore adjusted by the number of features (qFDR < 0.05/4 = 0.0125). (B) Symptom severity profiles of ASD classes based on total and domain-specific ADOS scores (i.e., social interaction, communication, repeated behavior). **Difference between subgroups at qFDR < 0.05; *Difference at P < 0.05 uncorrected.

