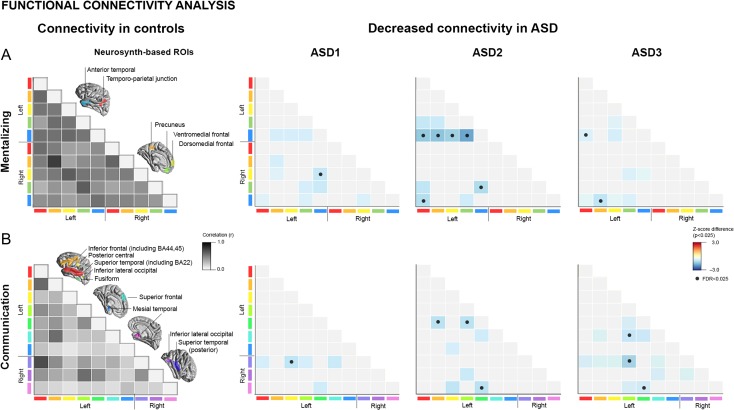
Figure 2.
Functional connectivity analyses. (A) We generated functional networks between regions-of-interest (ROIs) using an ad hoc meta-analysis of previous studies on mentalizing (upper panel) and communication (lower panel), based on Neurosynth.org. Networks in healthy controls are presented for reference on the left, with intensity values reflecting inter-regional connectivity strength. (B) Functional connectivity differences between the neuroanatomically defined ASD subtypes (see Fig. 1) and controls, with increases/decreases shown in red/blue. •Findings significant after network-wide FDR correction (qFDR < 0.05/2 = 0.025), furthermore adjusted by the number of networks.

