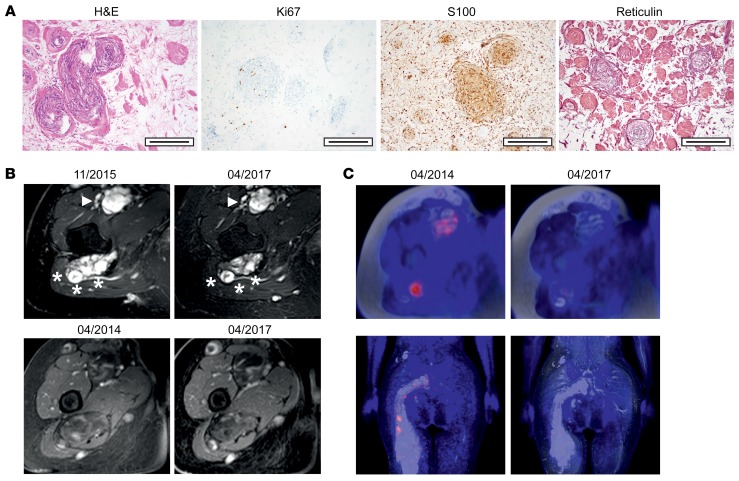
Figure 1. Histologic appearance, tumor burden, and assessment of response to lapatinib in a patient with N/S HNST.
(A) H&E, S100, reticulin, and Ki67 staining. Scale bars: 200 μm. (B) Axial MRI studies showing decreased tumor masses over time. Upper panel, T2-weighted and fat-suppressed images of hyperintense tumors along the right sciatic (asterisks) and femoral (arrowhead) nerves; lower panel, T1-weighted, contrast-enhanced, and fat-suppressed images of slightly and inhomogeneously contrast-enhancing tumors along the right sciatic and femoral nerves. (C) FDG-PET/MRI studies showing decreased tracer uptake over time. Upper row, axial images of tumors along the right sciatic and femoral nerves; lower row, coronal images of tumors along the right sciatic nerve.

