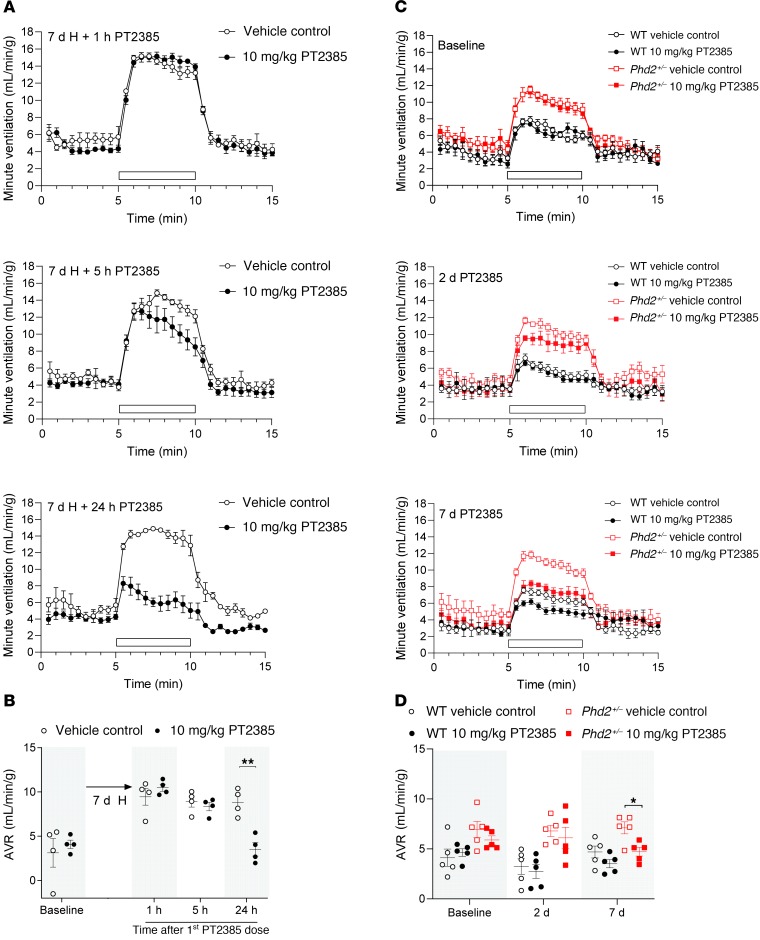
Figure 2. Reversal of enhanced ventilatory sensitivity in acclimatized WT and Phd2+/– male mice by PT2385.
Graphs illustrate changes in minute ventilation in response to an acute challenge with 10% O2/3% CO2 (white bars) before (baseline) and at the indicated times after the onset of twice daily treatment with 10 mg/kg PT2385. (A) Male mice were preexposed to 7 days of hypoxia (H, 10% oxygen), then treated with PT2385 (or vehicle) in continuing hypoxia (n = 4). (C) Phd2+/– or littermate WT male mice were treated with PT2385 (or vehicle) and maintained in normal air (n = 5). (B and D) Summary of AVRs calculated from data shown in A and C and from measurements taken before the start of the experiment in A (baseline). Data from B and D were analyzed by Holm-Sidak’s multiple comparisons 2-tailed tests (for all time points within each genotype for D), for which significance is reported in the graphs. *P < 0.05; **P < 0.01.

