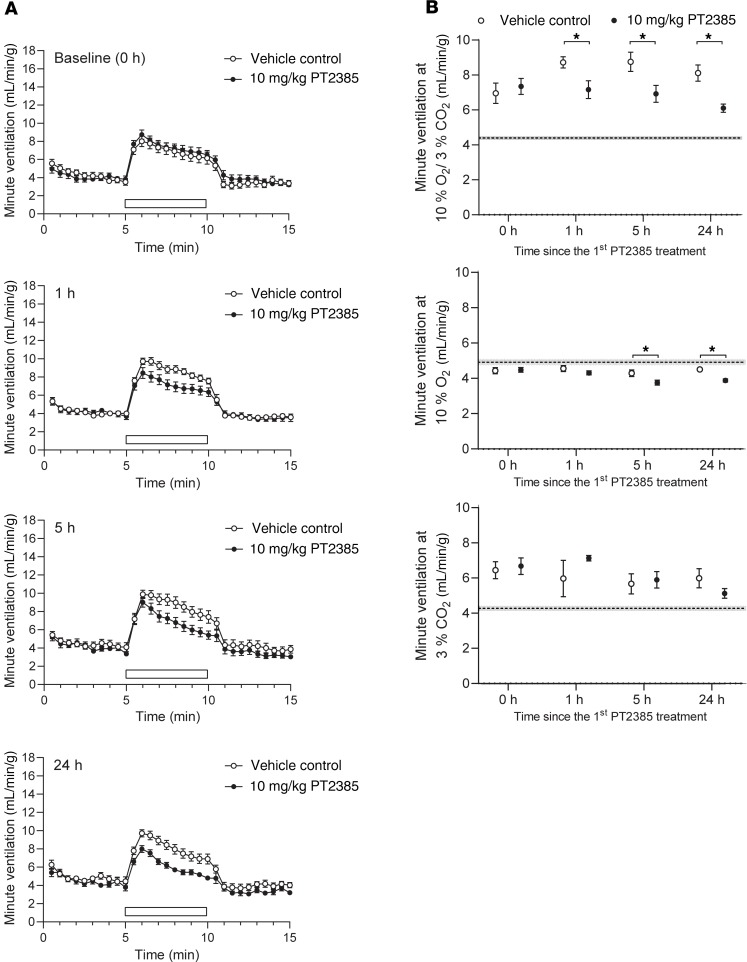
Figure 3. Rapid reduction in ventilatory sensitivity to hypoxia in unacclimatized PT2385-treated male mice.
(A) Graphs show changes in minute ventilation in response to an acute (5 minutes) challenge with 10% O2/3% CO2 (white bars). (B) Graphs show average minute ventilation during 5-minute challenges with 10% O2/3% CO2 (upper panel), 10% O2 (middle panel), or 3% CO2 (lower panel). Measurements for A and B were made before (baseline, 0 hours) and 1, 5, and 24 hours after the first 10 mg/kg PT2385 (or vehicle) dose (n = 15, except for 3% CO2 at 1 hour where n = 3); second dose of PT2385 was given immediately after the 5-hour measurements. Data were analyzed by Holm-Sidak’s multiple comparisons 2-tailed tests, for which significance is reported in the graphs. *P < 0.05. Dotted lines show the average resting minute ventilation in air before the acute gas challenge, across all time points and treatment groups. Data are shown as mean ± SEM (shaded area around the dotted line).

