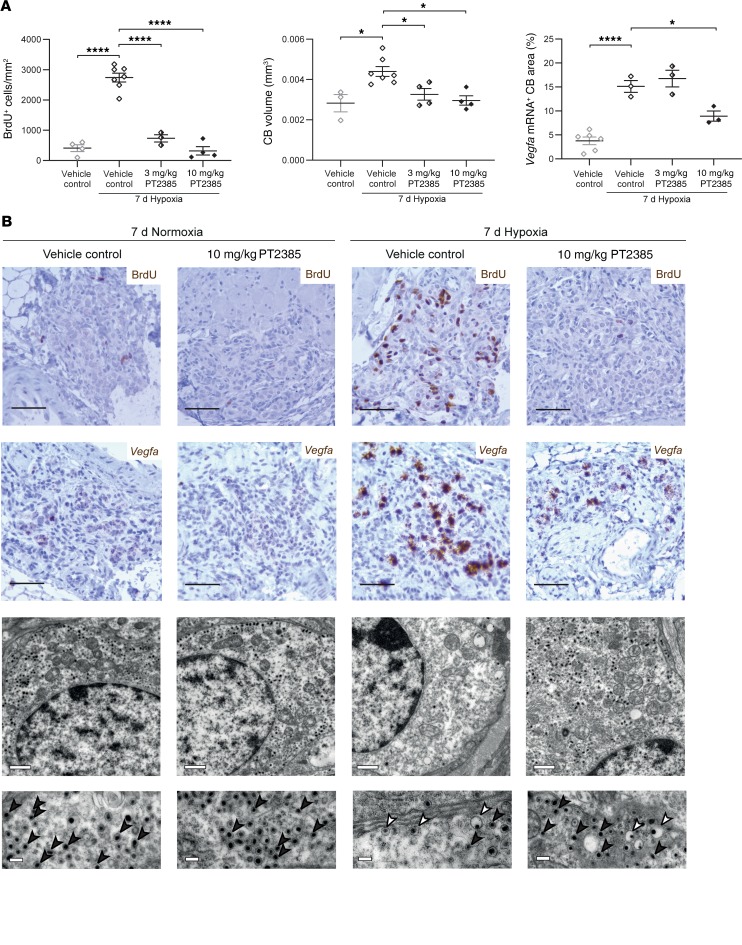
Figure 4. Effects of PT2385 on cellular responses to hypoxia in the carotid body.
(A) Morphometry and (B) representative images of carotid bodies (CBs) from WT male mice exposed to 7 days of hypoxia (10% oxygen) or normoxia and treated twice daily with 3 or 10 mg/kg PT2385 (or vehicle), beginning 24 hours before and continuing throughout 7-day exposure to hypoxia (10% oxygen) or normoxia (to a total of 8 days of treatment). (A) Quantification of BrdU+ cells per mm2 (left panel), CB volumes (middle panel), and Vegfa mRNA+ CB area (right panel). Data were analyzed by 1-way ANOVA, followed by Holm-Sidak’s multiple comparisons 2-tailed tests, for which significance is reported in the graphs. *P < 0.05; ****P < 0.0001. (B) Immunostaining for BrdU; Vegfa mRNA in situ hybridization; representative electron micrographs showing the DCVs in type I cells of the CB (note that changes induced by hypoxia are not observed in mice treated with PT2385; compare third and fourth columns) (n = 2). Scale bars: 50 μm (top 2 panels); 1 μm (top electron micrograph panels); and 200 nm (bottom electron micrograph panels). Black arrowheads show typical DCVs, while white arrowheads show “eccentric” DCVs. Images of carotid bodies of mice treated with 3 mg/kg PT2385 are shown in Supplemental Figure 8.

