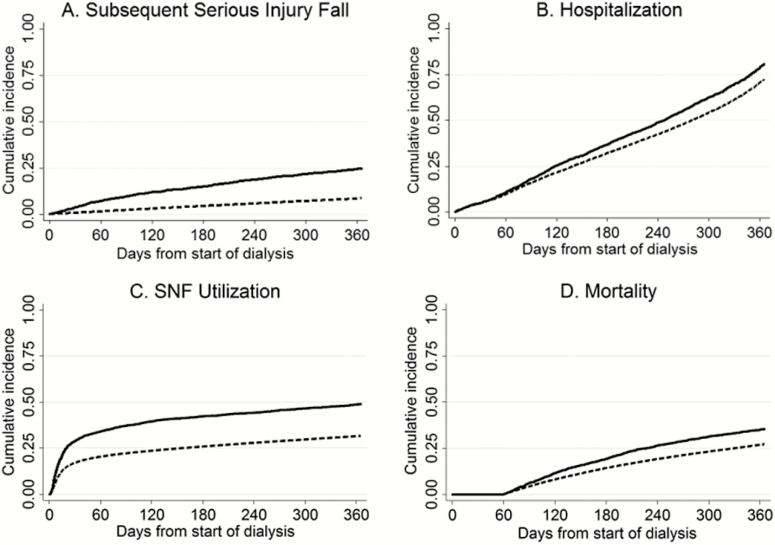
Figure 1.
Kaplan–Meier curves showing 1-year cumulative incidence of (A) serious fall injury, (B) hospital admission, (C) post-acute skilled nursing facility utilization, and (D) mortality, by history of serious fall injury. Solid lines, history of serious fall injury, dashed lines, no history of serious fall injury. SNF = Skilled nursing facility. p < .001 by log-rank test for all.

