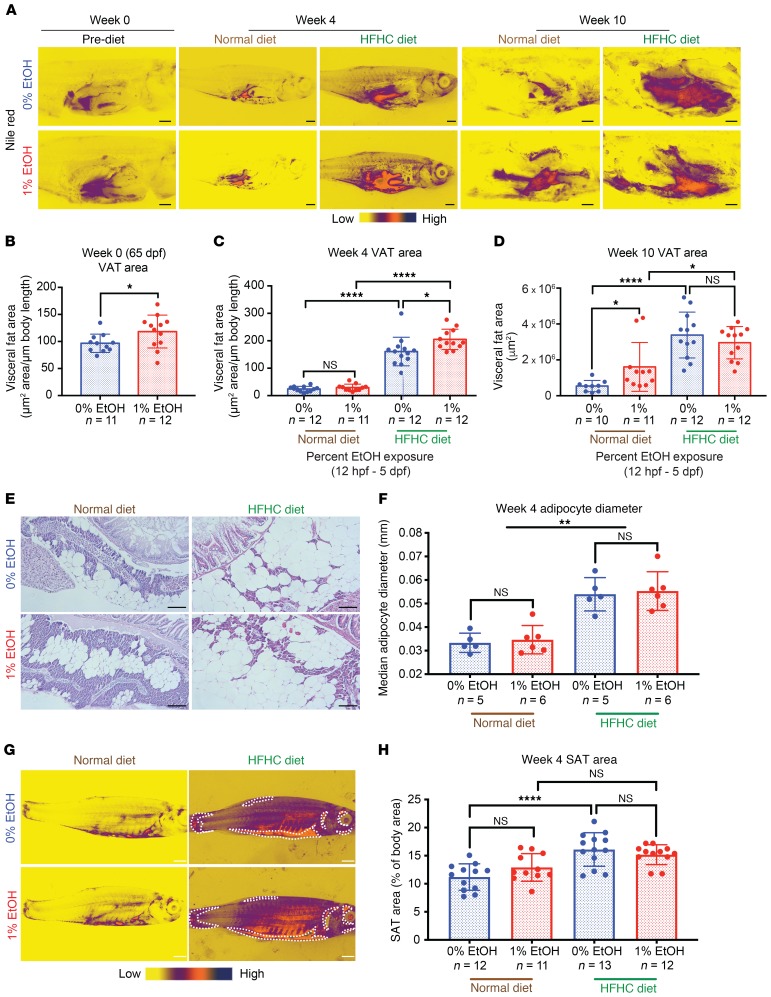
Figure 3. EAE is a risk factor for increased visceral adiposity in adulthood.
(A) Nile red staining of internal organs and VAT visualized after skin and body wall muscle removal. Scale bars: 1 mm. (B) Quantification of VAT area before diet challenge. 1% EtOH–exposed (12 hpf–5 dpf) males have a larger VAT depot than controls at 65 dpf. *P = 0.0497, Student’s unpaired 2-tailed t test. (C) Quantification of VAT area after 4 weeks of diet challenge. EAE adults have a larger VAT than controls in response to HFHC. *P = 0.0103; ****P < 0.0001, 2-way ANOVA with Tukey’s multiple comparisons test. (D) Quantification of VAT area after 10 weeks of diet challenge. EAE adults receiving the ND have a larger VAT than controls. *P = 0.0102, Student’s 2-tailed unpaired t test. HFHC diet induces significant gains in VAT area in both control and EAE adults (*P = 0.0228 [1% EtOH ND versus HFHC], ****P < 0.0001 [0% EtOH ND versus HFHC], 2-way ANOVA Tukey’s multiple comparisons test). (E) H&E staining of PVAT following 4 weeks of diet challenge. Scale bars: 0.01 mm. (F) Quantification of PVAT adipocyte diameter following normal and HFHC diet. **P = 0.001, 2-way ANOVA. (G) Nile red staining of SAT (dotted white outline). Scale bars: 1 mm. Body-wide quantification of SAT was accomplished by combining 2 photos in ImageJ using collage photomerge. (H) Quantification of SAT area after 4 weeks of diet challenge. ****P < 0.0001, 2-way ANOVA Tukey’s multiple comparisons test. Error bars show mean with SD. Sample numbers (n) noted under figure panels.

