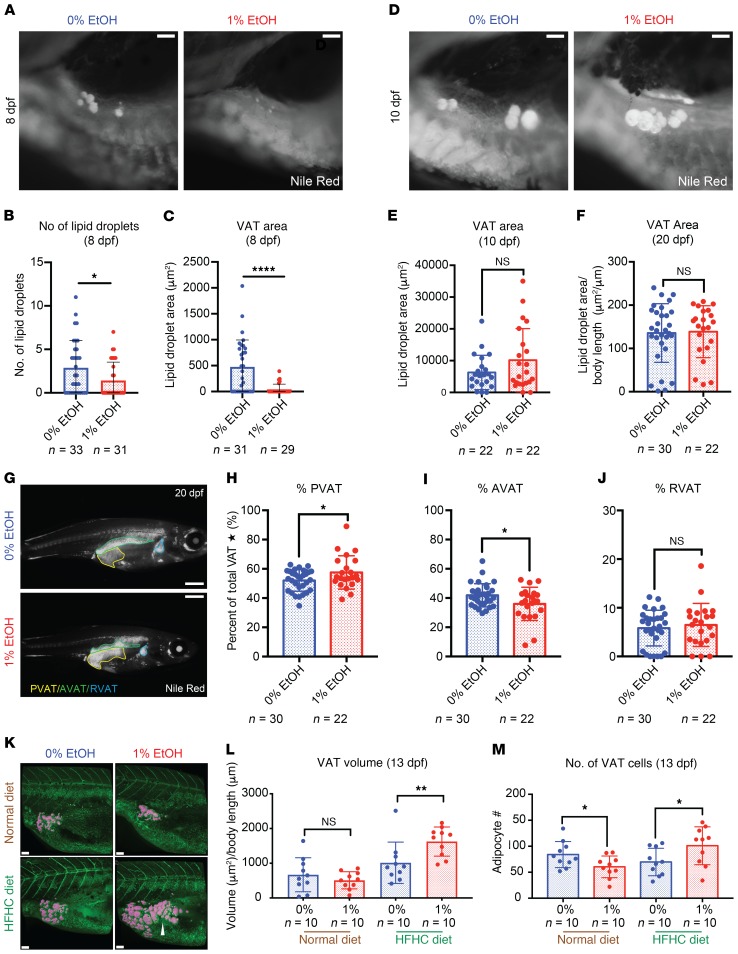
Figure 5. EAE disrupts VAT development and diet-induced VAT gain in larvae.
(A) EAE delays adipocyte development at 8 dpf as visualized by Nile red staining. Scale bars: 1 mm. (B) EAE reduces lipid droplet number at 8 dpf. *P = 0.034, Student’s unpaired 2-tailed t test. (C) EAE reduces VAT area at 8 dpf. ****P < 0.0001, Student’s unpaired 2-tailed t test. (D) EAE-treated larvae recover from delayed adipocyte development by 10 dpf as visualized by Nile red staining. Scale bars: 0.1 mm. (E and F) VAT area recovers by 10 dpf and 20 dpf, and no significant differences in total VAT area are observed. (G) VAT distribution, visualized by Nile red staining, is altered in EAE larvae by 20 dpf. Scale bars: 1 mm. (H–J) EAE larvae have more PVAT than AVAT as a percentage of total VAT area (H: P = 0.0412; I: P = 0.0322, Student’s unpaired 2-tailed t test; *P < 0.05). RVAT area is not affected by 1% EtOH exposure. Star indicates that total VAT corresponds to RVAT + PVAT + AVAT. (K) 3D confocal reconstruction (pink) of Nile red–stained VAT under normal and HFHC diet conditions. Scale bars: 100 μm. (L) EAE larvae have a larger VAT volume than controls under HFHC diet but not ND conditions. **P = 0.0096, 2-way ANOVA with Šidák’s multiple comparisons test. (M) EAE larvae receiving ND have reduced VAT cell number at 13 dpf (P = 0.0345). HFHC diet increases adipocyte number in EAE larvae (P = 0.0410). *P < 0.05. Unpaired 2-tailed Student’s t test. Error bars show mean with SD. Sample numbers (n) noted under figure panels.

