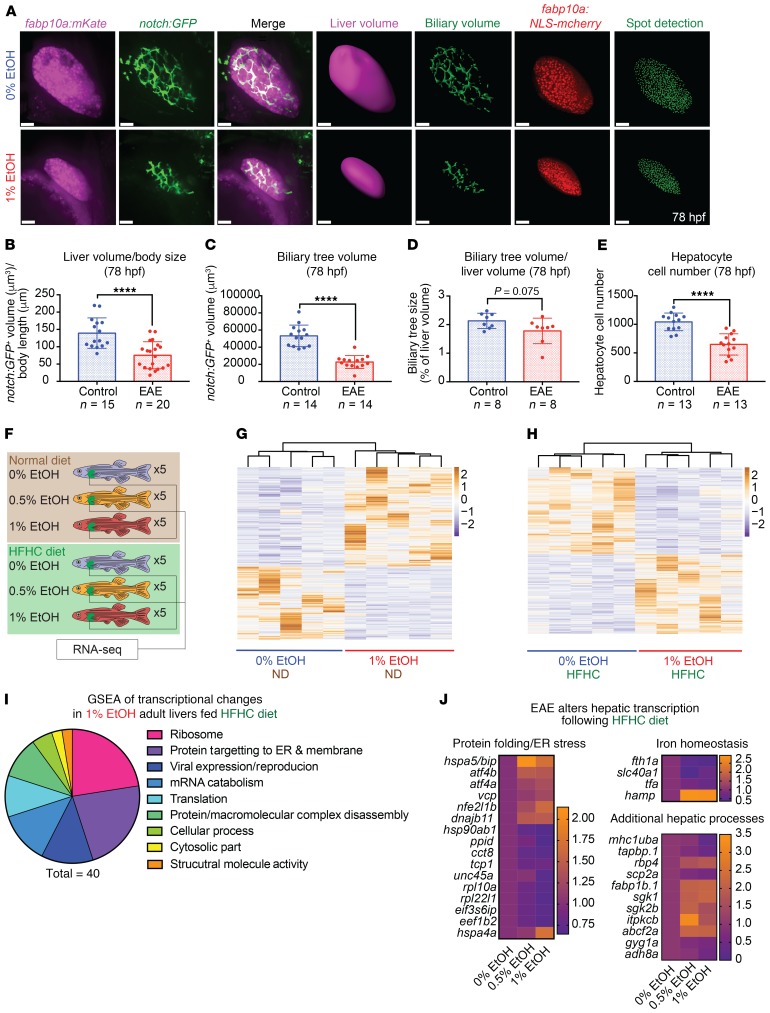
Figure 7. Ethanol impairs embryonic liver growth and alters liver response to HFHC diet.
(A) EtOH (12 hpf–78 hpf) reduces the size of the fabp10a:mKate+ liver and the size and complexity of the tp1glob:eGFP+ biliary tree at 78 hpf. Liver and biliary volumes were achieved through 3D reconstruction based on confocal imaging of the Tg(fabp10a:mKate+) and Tg(tp1glob:eGFP) reporters. Confocal imaging and Imaris 3D spot detection of nuclei in Tg(fabp10a:NLS-mcherry) embryos demonstrate that EtOH exposure reduces hepatocyte nuclei number. Scale bars: 60 μm. (B) EAE reduces liver volume relative to body size. ****P < 0.0001, unpaired 2-tailed Student’s t test. (C and D) EAE reduces biliary tree volume, but proportionally to liver volume reduction. ****P < 0.0001, unpaired 2-tailed Student’s t test. (E) Hepatocyte number is reduced in 1% EtOH larvae relative to matched controls. ****P < 0.0001, unpaired 2-tailed Student’s t test. (F) Schematic of RNA-Seq of adult livers after 8 weeks of normal and HFHC diet challenge. (G and H) Heatmap of dysregulated (P < 0.05) genes following sequencing of 0% and 1% EtOH (12 hpf–5 dpf) adults receiving ND and HFHC diet. (I) GSEA of genes significantly dysregulated (P < 0.05) in 1% EtOH (12 hpf–5 dpf) adults receiving the HFHC diet. (J) Alterations in hepatic transcripts following HFHC diet challenge (P < 0.05). Heatmap P values were determined using a negative binomial test with Wald’s test from RNA-Seq analysis. Sample numbers (n) noted under figure panels.

