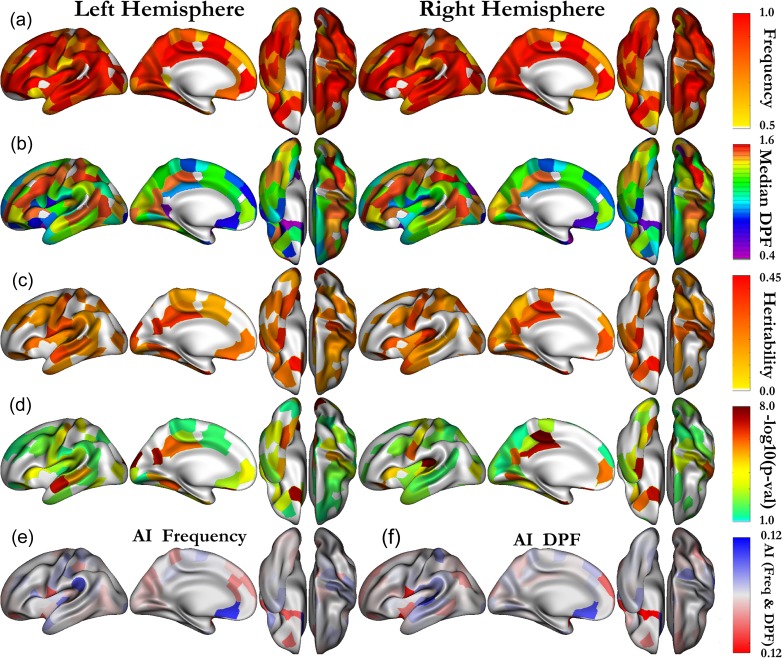
Figure 3.
(a) Deep pits frequency and (b) median DPF of the pits selected as phenotypes in each areal. (c) Heritability and (d) associated –log10(P-values) for all the areals being significant without correction (P < 0.05). The areals which are significant after strict Bonferroni are shown with a color above yellow. Both left and right hemisphere results (a, b, c, d) are presented on the symmetrized (left) template. (e) Asymmetry Index frequency. (f) Asymmetry Index median DPF.

