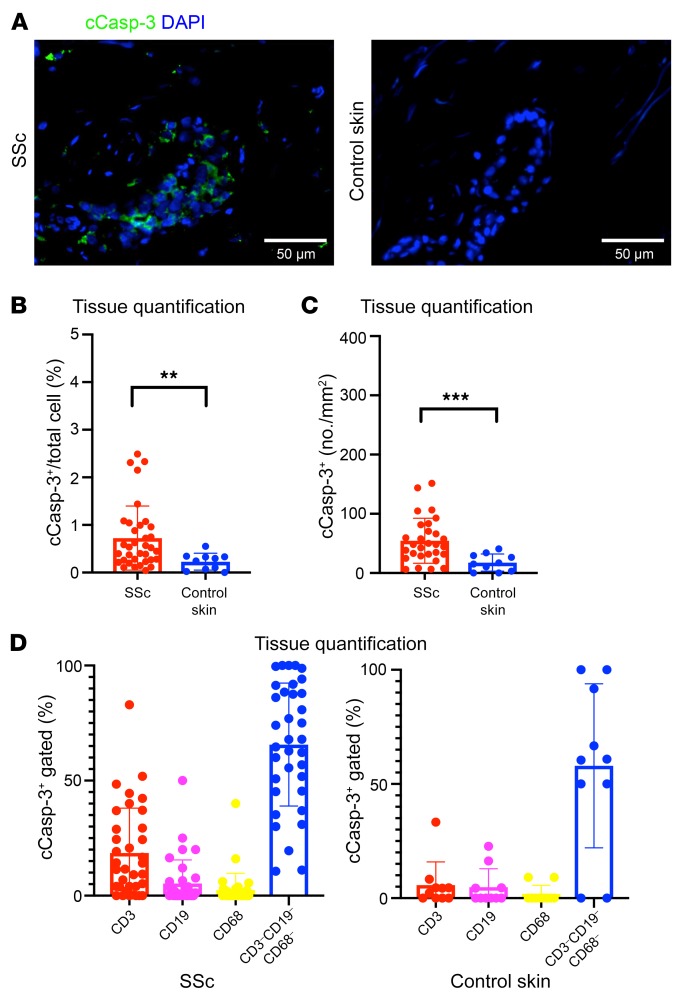
Figure 4. Apoptotic cells are frequently seen in SSc tissues.
(A) Representative multicolor immunofluorescence images showing cleaved caspase-3 (cCasp-3) staining (green) in SSc and control skin samples. (B and C) Proportions (B) and absolute numbers (C) of cCasp-3+ apoptotic cells in SSc (n = 35) and control skin (n = 10). (D) Proportions of apoptotic cells in SSc (n = 35) and control skin (n = 10) accounted for by T cells (red), B cells (purple), macrophages (yellow), and other cells (blue). Data are presented as mean ± SEM. **P < 0.01, ***P < 0.001 by Mann-Whitney U test.

