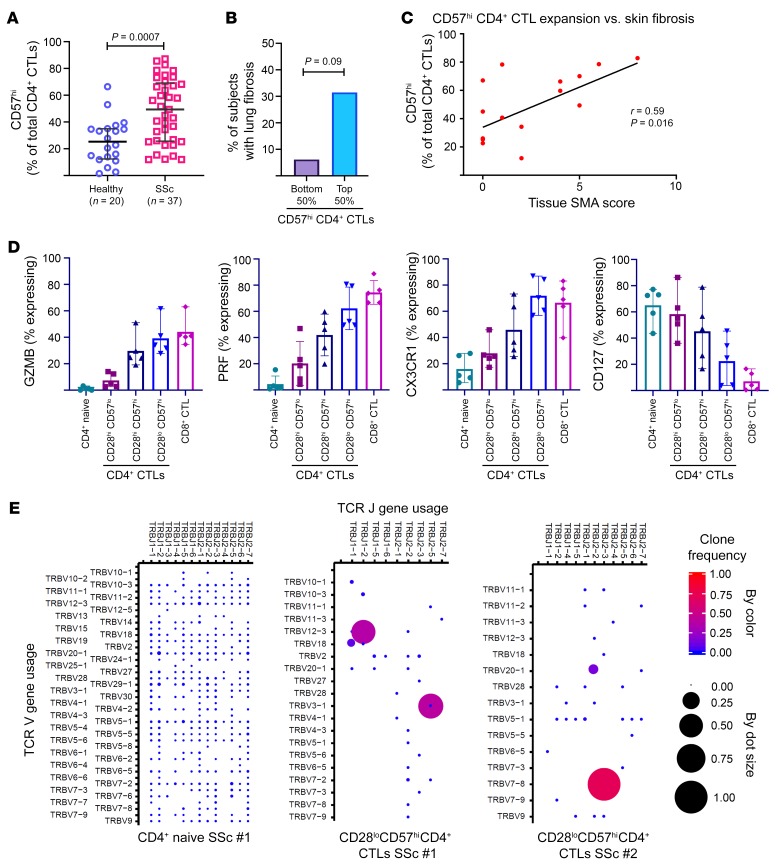
Figure 6. Effector CD4+ CTLs are clonally expanded and correlate with tissue fibrosis in SSc.
(A) Dot plot demonstrates marked expansion of CD57hiCD4+ CTLs comparing SSc subjects (n = 37) to age-matched healthy donors (n = 20). Lines represent medians with standard deviation. Mann-Whitney U test was used to calculate P value. (B) Bar chart showing increased frequency of lung fibrosis among SSc patients with greater CD57hiCD4+ CTL expansions. Proportion of patients in each group is plotted. P value was calculated by Fisher’s exact test. (C) X-Y plot showing positive correlation between CD57hiCD4+ CTL expansion and tissue α-smooth muscle actin (α-SMA) staining. Linear regression was used to calculate P value. (D) Scatter plots with mean and range displaying the percentage of each T cell subset expressing granzyme B (GZMB), perforin (PRF), CX3CR1, and CD127. (E) Dot plots show the TCR repertoire comprising effector CD4+ CTLs from 2 SSc subjects (middle and right). TCR repertoire from a naive CD4+ T cell population is shown for reference (far left).

