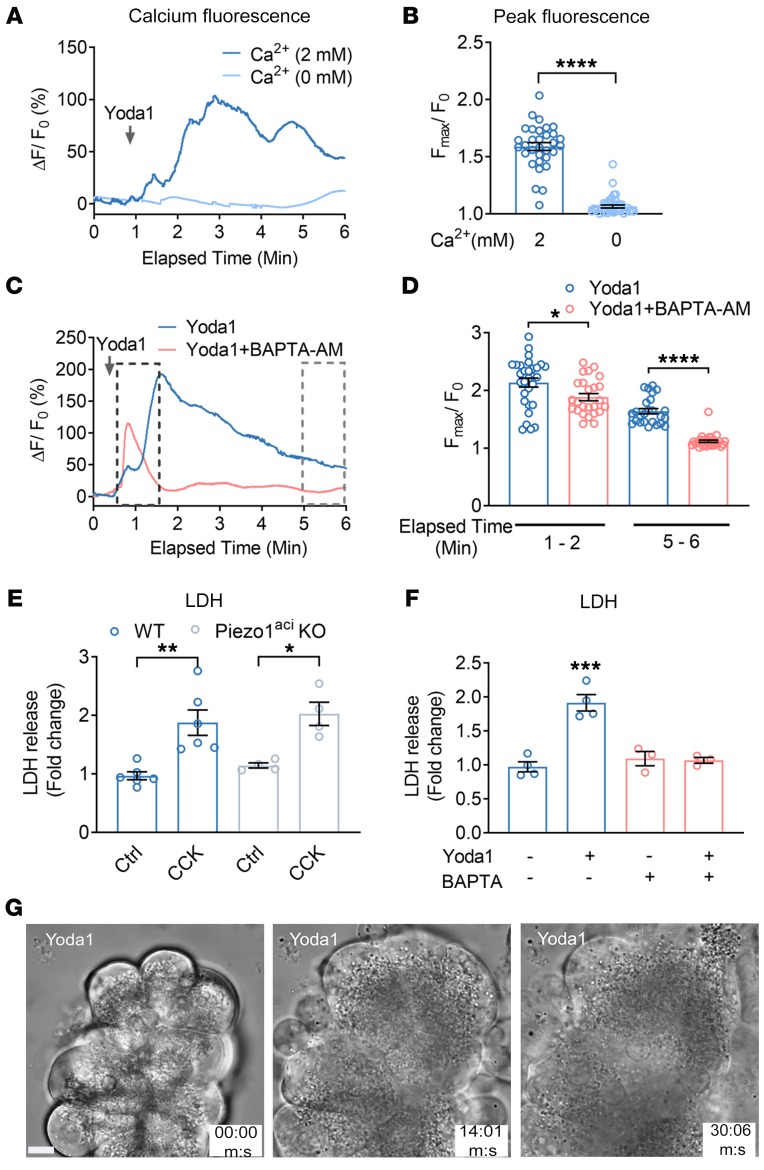
Figure 1. Piezo1 activation increases [Ca2+]i and induces cell death in pancreatic acini.
(A) Live-cell imaging of pancreatic acini loaded with calcium 6-QF. Pancreatic acini were incubated with Yoda1 (25 μM) in the presence (2 mM) or absence (0 mM) of extracellular calcium. Yoda1 was added at the time indicated by the arrow. (B) Comparison of the Yoda1-induced peak [Ca2+]i is expressed as the ratio of peak intensity (Fmax)/baseline intensity (F0) from 32 to 41 cells. (C) The effects of Yoda1 (50 μM) on [Ca2+]i in the absence or presence of the calcium chelator BAPTA-AM (20 μM). (D) Statistical analysis of peak (Fmax/F0) from 25 to 30 cells in which acinar cells were preincubated 30 minutes with BAPTA-AM (20 μM) before Yoda1 application. (Fmax/F0) was calculated from the time periods 1 to 2 minutes and 5 to 6 minutes to assess the initial transient and sustained [Ca2+]i levels, respectively. (E) The effects of CCK (1 nM) on LDH release from isolated pancreatic acini from WT and Piezo1aci-KO mice from 4 to 6 experiments. (F) The effects of Yoda1 (50 μM) on LDH release from acinar cells with and without preincubation of BAPTA-AM for 30 minutes are shown from 3 to 5 experiments. (G) Brightfield images of pancreatic acini at different time points in the presence of Yoda1 (50 μM). Images represent a plane (5 μm thick) from a Z-stack of captured images to visualize the changes in cell morphology and granule movement. Images were captured with a ×100 oil objective. Statistical analyses were performed using Student’s t test (B, D) and 1-way ANOVA with Tukey’s multiple comparison test (E and F). *P ≤ 0.05; **P ≤ 0.01; ***P ≤ 0.001, ****P ≤ 0.0001. Data are shown as mean ± SEM. Scale bar: 10 μm.

