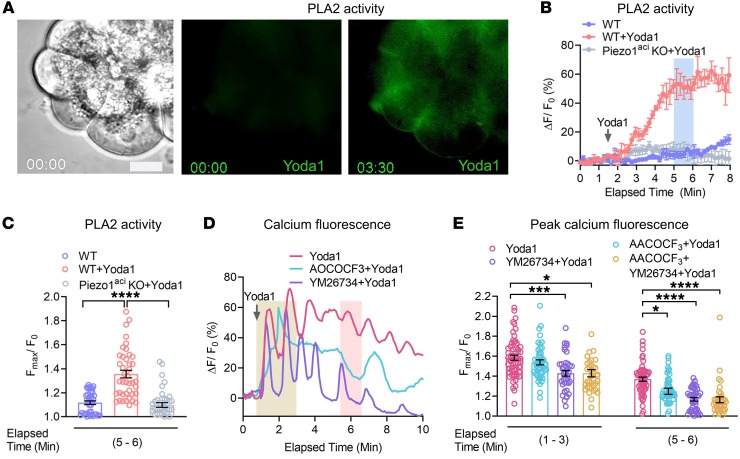
Figure 6. The Piezo1 agonist, Yoda1, induces activation of PLA2 activity.
(A) Brightfield and fluorescence images of BODIPY FL C11-PC loaded pancreatic acini at time 0 and 3:30 minutes after Yoda1 (25 μM) application. Scale bar: 10 μm. (B) Traces represent the live-cell PLA2 activity upon Yoda1 (25 M) application from 4 experiments. Representative tracings of acini from WT and Piezo1aci-KO mice are shown. The peak fluorescence intensity was calculated from the elapsed time at 5 to 6 minutes (blue bar). (C) Peak fluorescence intensity of BODIPY FL C11-PC dye measured at an elapsed time of 5 to 6 minutes from 40 to 51 cells. (D and E) The traces and graph show the effects of Yoda1 (25 μM) on [Ca2+]i in pancreatic acini with or without treatment with the cytoplasmic PLA2 blocker AACOCF3 (30 μM) and secretory PLA2 blocker YM26734 (10 μM). YM26734 and AACOCF3 were preincubated 10 minutes before application of Yoda1. The transient calcium peaks were measured from signals obtained between 1 to 3 minutes (yellow bar), and sustained calcium peaks were measured from signals from 5.5 to 6.5 minutes (pink bar). Data represent the averages of 36–58 cells. Values were expressed as the mean ± SEM, and mean differences between multiple groups were analyzed by 1-way ANOVA with Tukey’s multiple comparison. *P ≤ 0.05; *** P ≤ 0.001; ****P ≤ 0.0001. Scale bar: 10 μm.

